Estonian vs Immigrants from Morocco Unemployment Among Ages 55 to 59 years
COMPARE
Estonian
Immigrants from Morocco
Unemployment Among Ages 55 to 59 years
Unemployment Among Ages 55 to 59 years Comparison
Estonians
Immigrants from Morocco
4.9%
UNEMPLOYMENT AMONG AGES 55 TO 59 YEARS
27.2/ 100
METRIC RATING
195th/ 347
METRIC RANK
4.8%
UNEMPLOYMENT AMONG AGES 55 TO 59 YEARS
36.5/ 100
METRIC RATING
187th/ 347
METRIC RANK
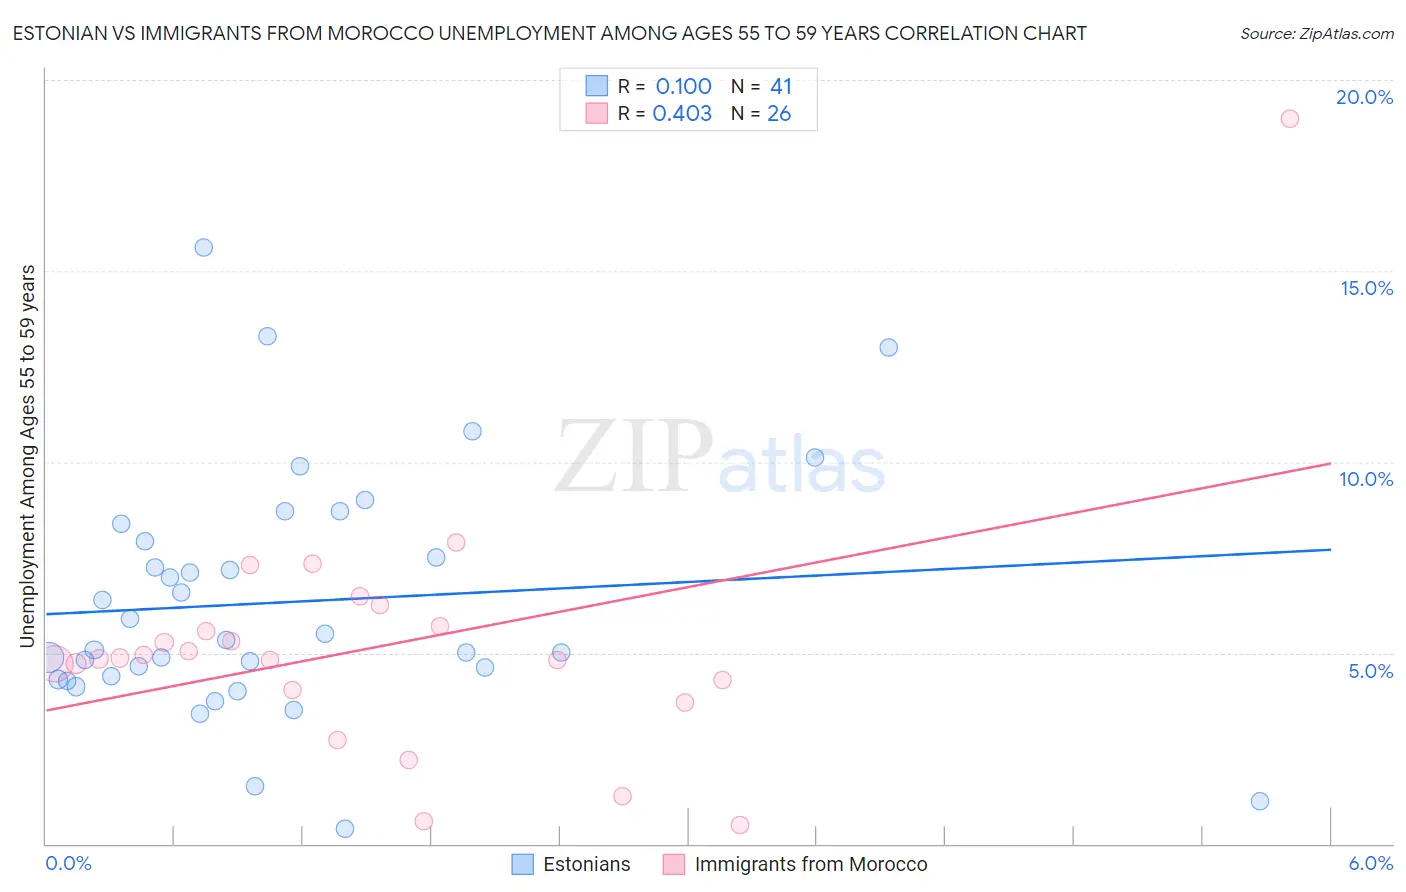
Estonian vs Immigrants from Morocco Unemployment Among Ages 55 to 59 years Correlation Chart
The statistical analysis conducted on geographies consisting of 120,209,999 people shows a slight positive correlation between the proportion of Estonians and unemployment rate among population between the ages 55 and 59 in the United States with a correlation coefficient (R) of 0.100 and weighted average of 4.9%. Similarly, the statistical analysis conducted on geographies consisting of 174,332,539 people shows a moderate positive correlation between the proportion of Immigrants from Morocco and unemployment rate among population between the ages 55 and 59 in the United States with a correlation coefficient (R) of 0.403 and weighted average of 4.8%, a difference of 0.44%.
Unemployment Among Ages 55 to 59 years Correlation Summary
| Measurement | Estonian | Immigrants from Morocco |
| Minimum | 0.40% | 0.50% |
| Maximum | 15.6% | 19.0% |
| Range | 15.2% | 18.5% |
| Mean | 6.3% | 5.2% |
| Median | 5.3% | 4.8% |
| Interquartile 25% (IQ1) | 4.3% | 4.0% |
| Interquartile 75% (IQ3) | 8.1% | 5.7% |
| Interquartile Range (IQR) | 3.8% | 1.7% |
| Standard Deviation (Sample) | 3.2% | 3.4% |
| Standard Deviation (Population) | 3.2% | 3.3% |
Demographics Similar to Estonians and Immigrants from Morocco by Unemployment Among Ages 55 to 59 years
In terms of unemployment among ages 55 to 59 years, the demographic groups most similar to Estonians are Spaniard (4.9%, a difference of 0.0%), Eastern European (4.9%, a difference of 0.030%), Macedonian (4.9%, a difference of 0.040%), Immigrants from Philippines (4.9%, a difference of 0.050%), and Immigrants from Italy (4.9%, a difference of 0.14%). Similarly, the demographic groups most similar to Immigrants from Morocco are Peruvian (4.8%, a difference of 0.020%), Osage (4.8%, a difference of 0.020%), Immigrants from Eastern Asia (4.8%, a difference of 0.020%), Immigrants from Czechoslovakia (4.8%, a difference of 0.070%), and Immigrants from Peru (4.8%, a difference of 0.090%).
| Demographics | Rating | Rank | Unemployment Among Ages 55 to 59 years |
| Immigrants | Hungary | 40.4 /100 | #181 | Average 4.8% |
| Immigrants | Europe | 40.4 /100 | #182 | Average 4.8% |
| Immigrants | Peru | 38.6 /100 | #183 | Fair 4.8% |
| Immigrants | Czechoslovakia | 38.0 /100 | #184 | Fair 4.8% |
| Peruvians | 37.0 /100 | #185 | Fair 4.8% |
| Osage | 37.0 /100 | #186 | Fair 4.8% |
| Immigrants | Morocco | 36.5 /100 | #187 | Fair 4.8% |
| Immigrants | Eastern Asia | 36.1 /100 | #188 | Fair 4.8% |
| Iroquois | 34.5 /100 | #189 | Fair 4.9% |
| Russians | 33.9 /100 | #190 | Fair 4.9% |
| Iranians | 32.4 /100 | #191 | Fair 4.9% |
| Immigrants | Ukraine | 31.7 /100 | #192 | Fair 4.9% |
| Immigrants | Italy | 30.1 /100 | #193 | Fair 4.9% |
| Spaniards | 27.2 /100 | #194 | Fair 4.9% |
| Estonians | 27.2 /100 | #195 | Fair 4.9% |
| Eastern Europeans | 26.7 /100 | #196 | Fair 4.9% |
| Macedonians | 26.4 /100 | #197 | Fair 4.9% |
| Immigrants | Philippines | 26.1 /100 | #198 | Fair 4.9% |
| Immigrants | Russia | 23.7 /100 | #199 | Fair 4.9% |
| Basques | 23.3 /100 | #200 | Fair 4.9% |
| Immigrants | South America | 23.1 /100 | #201 | Fair 4.9% |