English vs Immigrants from Scotland Unemployment
COMPARE
English
Immigrants from Scotland
Unemployment
Unemployment Comparison
English
Immigrants from Scotland
4.6%
UNEMPLOYMENT
100.0/ 100
METRIC RATING
11th/ 347
METRIC RANK
4.9%
UNEMPLOYMENT
99.3/ 100
METRIC RATING
48th/ 347
METRIC RANK
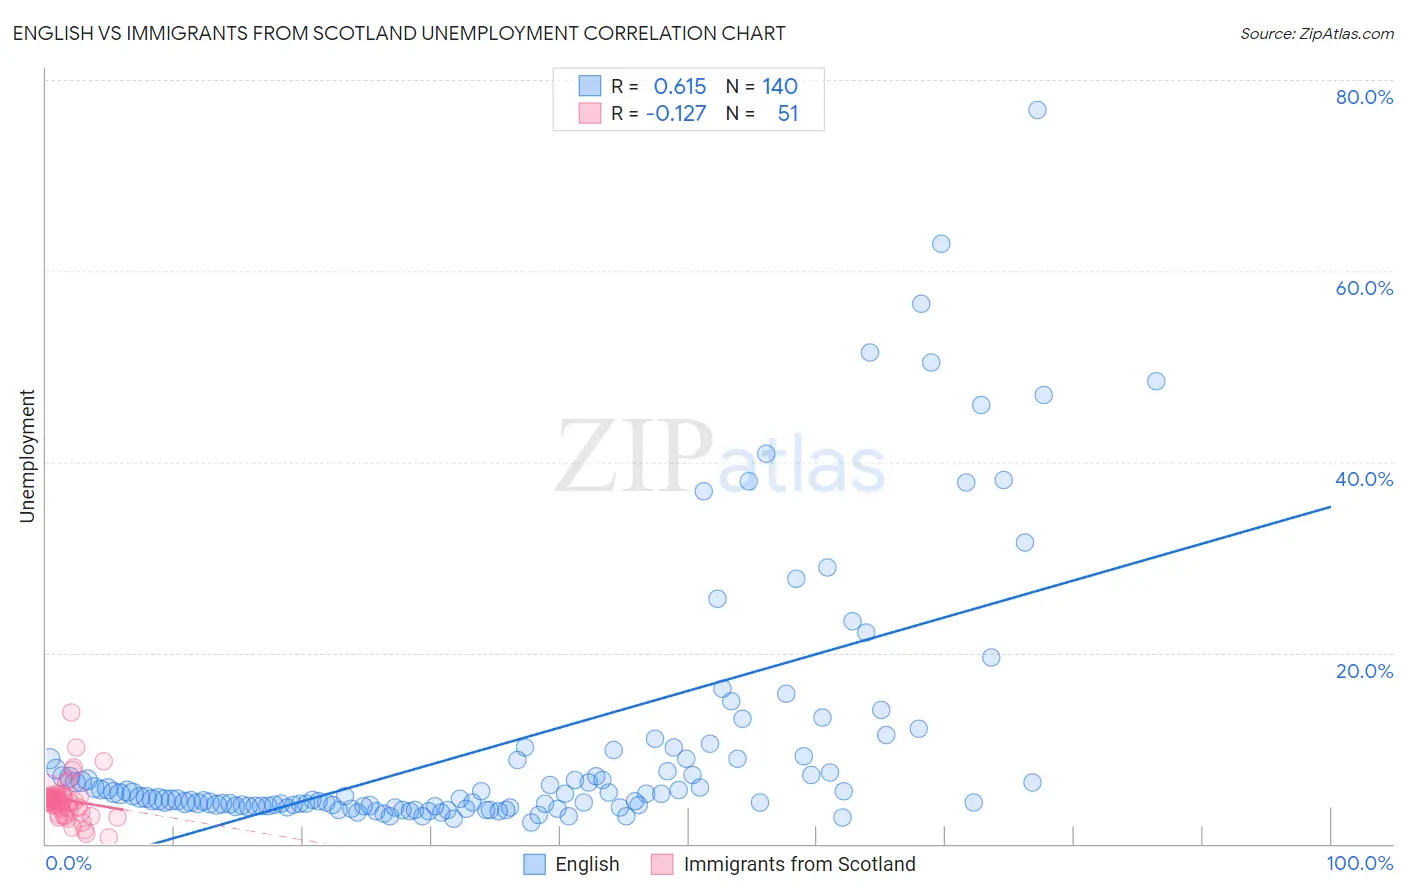
English vs Immigrants from Scotland Unemployment Correlation Chart
The statistical analysis conducted on geographies consisting of 574,199,976 people shows a significant positive correlation between the proportion of English and unemployment in the United States with a correlation coefficient (R) of 0.615 and weighted average of 4.6%. Similarly, the statistical analysis conducted on geographies consisting of 196,312,940 people shows a poor negative correlation between the proportion of Immigrants from Scotland and unemployment in the United States with a correlation coefficient (R) of -0.127 and weighted average of 4.9%, a difference of 5.6%.
Unemployment Correlation Summary
| Measurement | English | Immigrants from Scotland |
| Minimum | 2.3% | 0.60% |
| Maximum | 76.9% | 13.8% |
| Range | 74.6% | 13.2% |
| Mean | 10.6% | 4.6% |
| Median | 4.9% | 4.5% |
| Interquartile 25% (IQ1) | 4.0% | 3.3% |
| Interquartile 75% (IQ3) | 9.0% | 5.0% |
| Interquartile Range (IQR) | 5.0% | 1.7% |
| Standard Deviation (Sample) | 13.7% | 2.2% |
| Standard Deviation (Population) | 13.6% | 2.2% |
Similar Demographics by Unemployment
Demographics Similar to English by Unemployment
In terms of unemployment, the demographic groups most similar to English are Pennsylvania German (4.6%, a difference of 0.10%), Belgian (4.6%, a difference of 0.26%), Immigrants from Cuba (4.6%, a difference of 0.50%), Dutch (4.6%, a difference of 0.66%), and European (4.6%, a difference of 0.98%).
| Demographics | Rating | Rank | Unemployment |
| Danes | 100.0 /100 | #4 | Exceptional 4.3% |
| Swedes | 100.0 /100 | #5 | Exceptional 4.4% |
| Germans | 100.0 /100 | #6 | Exceptional 4.5% |
| Immigrants | India | 100.0 /100 | #7 | Exceptional 4.5% |
| Swiss | 100.0 /100 | #8 | Exceptional 4.5% |
| Scandinavians | 100.0 /100 | #9 | Exceptional 4.5% |
| Dutch | 100.0 /100 | #10 | Exceptional 4.6% |
| English | 100.0 /100 | #11 | Exceptional 4.6% |
| Pennsylvania Germans | 100.0 /100 | #12 | Exceptional 4.6% |
| Belgians | 100.0 /100 | #13 | Exceptional 4.6% |
| Immigrants | Cuba | 100.0 /100 | #14 | Exceptional 4.6% |
| Europeans | 99.9 /100 | #15 | Exceptional 4.6% |
| Chinese | 99.9 /100 | #16 | Exceptional 4.7% |
| Slovenes | 99.9 /100 | #17 | Exceptional 4.7% |
| Immigrants | Venezuela | 99.9 /100 | #18 | Exceptional 4.7% |
Demographics Similar to Immigrants from Scotland by Unemployment
In terms of unemployment, the demographic groups most similar to Immigrants from Scotland are Immigrants from South Central Asia (4.9%, a difference of 0.010%), French Canadian (4.9%, a difference of 0.030%), Immigrants from Belgium (4.9%, a difference of 0.19%), White/Caucasian (4.9%, a difference of 0.20%), and Immigrants from Taiwan (4.8%, a difference of 0.22%).
| Demographics | Rating | Rank | Unemployment |
| Immigrants | Bosnia and Herzegovina | 99.7 /100 | #41 | Exceptional 4.8% |
| Filipinos | 99.5 /100 | #42 | Exceptional 4.8% |
| Yugoslavians | 99.5 /100 | #43 | Exceptional 4.8% |
| Austrians | 99.5 /100 | #44 | Exceptional 4.8% |
| French | 99.5 /100 | #45 | Exceptional 4.8% |
| Immigrants | Nepal | 99.4 /100 | #46 | Exceptional 4.8% |
| Immigrants | Taiwan | 99.4 /100 | #47 | Exceptional 4.8% |
| Immigrants | Scotland | 99.3 /100 | #48 | Exceptional 4.9% |
| Immigrants | South Central Asia | 99.3 /100 | #49 | Exceptional 4.9% |
| French Canadians | 99.3 /100 | #50 | Exceptional 4.9% |
| Immigrants | Belgium | 99.2 /100 | #51 | Exceptional 4.9% |
| Whites/Caucasians | 99.2 /100 | #52 | Exceptional 4.9% |
| Immigrants | Zimbabwe | 99.2 /100 | #53 | Exceptional 4.9% |
| Eastern Europeans | 99.2 /100 | #54 | Exceptional 4.9% |
| Australians | 99.2 /100 | #55 | Exceptional 4.9% |