Egyptian vs Italian Female Unemployment
COMPARE
Egyptian
Italian
Female Unemployment
Female Unemployment Comparison
Egyptians
Italians
5.2%
FEMALE UNEMPLOYMENT
78.3/ 100
METRIC RATING
150th/ 347
METRIC RANK
4.8%
FEMALE UNEMPLOYMENT
99.5/ 100
METRIC RATING
42nd/ 347
METRIC RANK
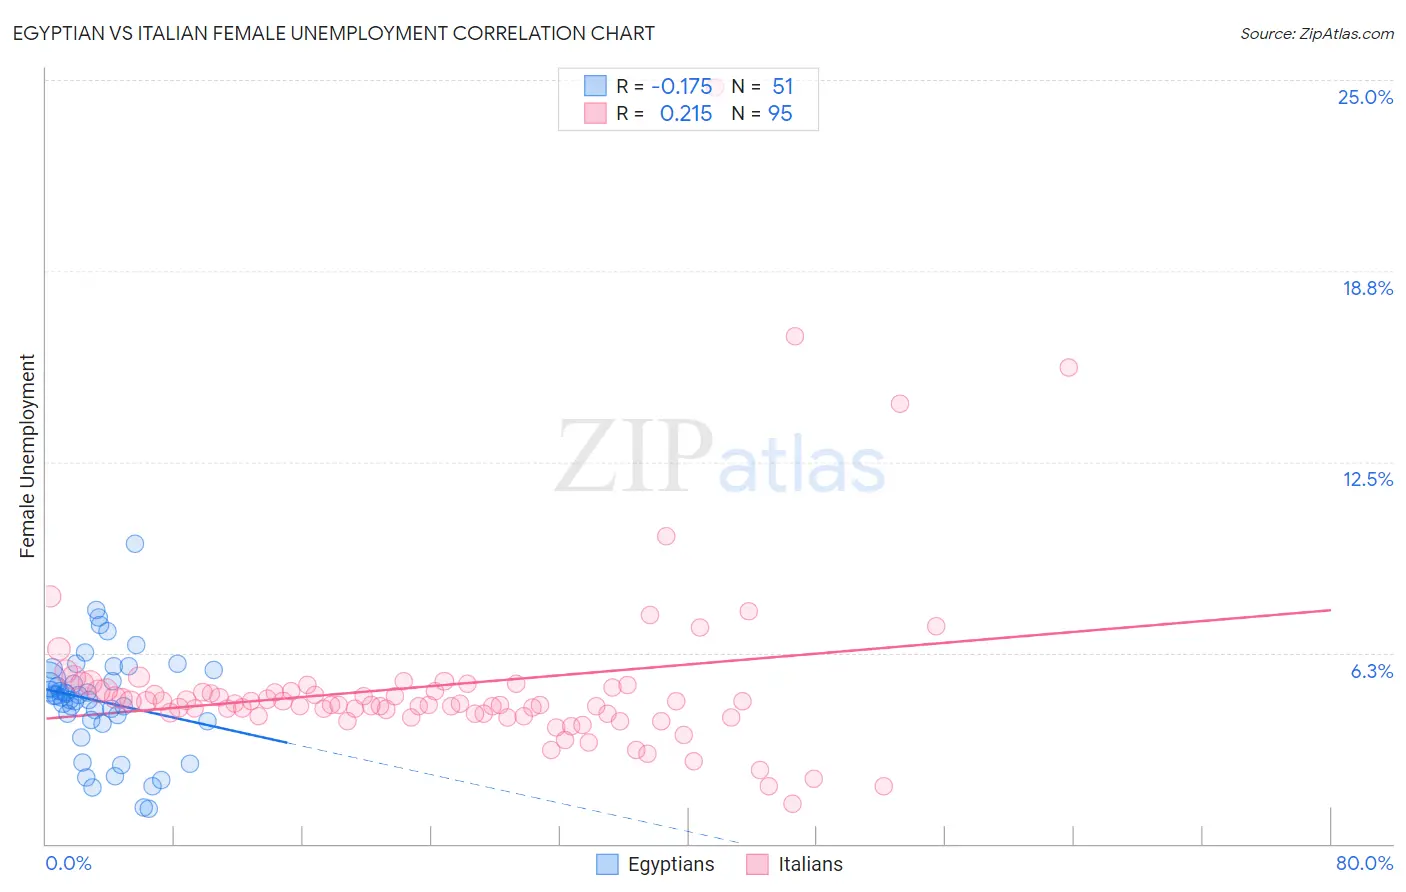
Egyptian vs Italian Female Unemployment Correlation Chart
The statistical analysis conducted on geographies consisting of 276,383,478 people shows a poor negative correlation between the proportion of Egyptians and unemploymnet rate among females in the United States with a correlation coefficient (R) of -0.175 and weighted average of 5.2%. Similarly, the statistical analysis conducted on geographies consisting of 560,779,263 people shows a weak positive correlation between the proportion of Italians and unemploymnet rate among females in the United States with a correlation coefficient (R) of 0.215 and weighted average of 4.8%, a difference of 6.5%.
Female Unemployment Correlation Summary
| Measurement | Egyptian | Italian |
| Minimum | 1.2% | 1.3% |
| Maximum | 9.8% | 24.8% |
| Range | 8.6% | 23.5% |
| Mean | 4.7% | 5.2% |
| Median | 4.9% | 4.6% |
| Interquartile 25% (IQ1) | 4.0% | 4.2% |
| Interquartile 75% (IQ3) | 5.7% | 5.0% |
| Interquartile Range (IQR) | 1.7% | 0.79% |
| Standard Deviation (Sample) | 1.7% | 3.1% |
| Standard Deviation (Population) | 1.7% | 3.0% |
Similar Demographics by Female Unemployment
Demographics Similar to Egyptians by Female Unemployment
In terms of female unemployment, the demographic groups most similar to Egyptians are Asian (5.2%, a difference of 0.010%), Immigrants from Argentina (5.2%, a difference of 0.040%), Argentinean (5.2%, a difference of 0.080%), Immigrants from Norway (5.2%, a difference of 0.10%), and Immigrants from Oceania (5.2%, a difference of 0.11%).
| Demographics | Rating | Rank | Female Unemployment |
| Immigrants | Kazakhstan | 80.7 /100 | #143 | Excellent 5.1% |
| Immigrants | Jordan | 80.4 /100 | #144 | Excellent 5.1% |
| Immigrants | Oceania | 79.5 /100 | #145 | Good 5.2% |
| Immigrants | Norway | 79.4 /100 | #146 | Good 5.2% |
| Argentineans | 79.2 /100 | #147 | Good 5.2% |
| Immigrants | Argentina | 78.7 /100 | #148 | Good 5.2% |
| Asians | 78.3 /100 | #149 | Good 5.2% |
| Egyptians | 78.3 /100 | #150 | Good 5.2% |
| Immigrants | China | 75.9 /100 | #151 | Good 5.2% |
| Immigrants | Italy | 75.0 /100 | #152 | Good 5.2% |
| Immigrants | Greece | 74.9 /100 | #153 | Good 5.2% |
| South Africans | 70.8 /100 | #154 | Good 5.2% |
| Immigrants | Egypt | 70.0 /100 | #155 | Good 5.2% |
| Immigrants | Northern Africa | 69.6 /100 | #156 | Good 5.2% |
| Immigrants | Russia | 69.3 /100 | #157 | Good 5.2% |
Demographics Similar to Italians by Female Unemployment
In terms of female unemployment, the demographic groups most similar to Italians are Tongan (4.8%, a difference of 0.13%), Eastern European (4.9%, a difference of 0.17%), Greek (4.9%, a difference of 0.28%), Austrian (4.9%, a difference of 0.36%), and Immigrants from Bulgaria (4.9%, a difference of 0.38%).
| Demographics | Rating | Rank | Female Unemployment |
| French Canadians | 99.7 /100 | #35 | Exceptional 4.8% |
| Yugoslavians | 99.7 /100 | #36 | Exceptional 4.8% |
| Pennsylvania Germans | 99.6 /100 | #37 | Exceptional 4.8% |
| Northern Europeans | 99.6 /100 | #38 | Exceptional 4.8% |
| Scotch-Irish | 99.6 /100 | #39 | Exceptional 4.8% |
| French | 99.6 /100 | #40 | Exceptional 4.8% |
| Tongans | 99.5 /100 | #41 | Exceptional 4.8% |
| Italians | 99.5 /100 | #42 | Exceptional 4.8% |
| Eastern Europeans | 99.4 /100 | #43 | Exceptional 4.9% |
| Greeks | 99.4 /100 | #44 | Exceptional 4.9% |
| Austrians | 99.3 /100 | #45 | Exceptional 4.9% |
| Immigrants | Bulgaria | 99.3 /100 | #46 | Exceptional 4.9% |
| Okinawans | 99.3 /100 | #47 | Exceptional 4.9% |
| Thais | 99.2 /100 | #48 | Exceptional 4.9% |
| Australians | 99.2 /100 | #49 | Exceptional 4.9% |