Egyptian vs Cambodian Unemployment

COMPARE

Egyptian
Race
Ancestry
AfghanAfricanAlaska NativeAlaskan AthabascanAlbanianAleutAlsatianAmericanApacheArabArapahoArgentineanArmenianAssyrian/Chaldean/SyriacAustralianAustrianBahamianBangladeshiBarbadianBasqueBelgianBelizeanBermudanBhutaneseBlackfeetBolivianBrazilianBritishBritish West IndianBulgarianBurmeseCajunCanadianCape VerdeanCarpatho RusynCelticCentral AmericanCentral American IndianCherokeeCheyenneChickasawChileanChineseChippewaChoctawColombianColvilleComancheCosta RicanCreeCreekCroatianCrowCubanCypriotCzechCzechoslovakianDanishDelawareDominicanDutchDutch West IndianEastern EuropeanEcuadorianEgyptianEnglishEstonianEthiopianEuropeanFijianFilipinoFinnishFrenchFrench American IndianFrench CanadianGermanGerman RussianGhanaianGreekGuamanian/ChamorroGuatemalanGuyaneseHaitianHmongHonduranHopiHoumaHungarianIcelanderIndian (Asian)IndonesianInupiatIranianIraqiIrishIroquoisIsraeliItalianJamaicanJapaneseJordanianKenyanKiowaKoreanLaotianLatvianLebaneseLiberianLithuanianLumbeeLuxembourgerMacedonianMalaysianMalteseMarshalleseMenomineeMexicanMexican American IndianMongolianMoroccanNative HawaiianNavajoNepaleseNew ZealanderNicaraguanNigerianNorthern EuropeanNorwegianOkinawanOsageOttawaPaiutePakistaniPalestinianPanamanianParaguayanPennsylvania GermanPeruvianPimaPolishPortuguesePotawatomiPuebloPuerto RicanPuget Sound SalishRomanianRussianSalvadoranSamoanScandinavianScotch-IrishScottishSeminoleSenegaleseSerbianShoshoneSierra LeoneanSiouxSlavicSlovakSloveneSomaliSouth AfricanSouth AmericanSouth American IndianSoviet UnionSpaniardSpanishSpanish AmericanSpanish American IndianSri LankanSubsaharan AfricanSudaneseSwedishSwissSyrianTaiwaneseThaiTlingit-HaidaTohono O'OdhamTonganTrinidadian and TobagonianTsimshianTurkishU.S. Virgin IslanderUgandanUkrainianUruguayanUteVenezuelanVietnameseWelshWest IndianYakamaYaquiYugoslavianYumanYup'ikZimbabwean
Immigration
NonimmigrantsImmigrantsAfghanistanAfricaAlbaniaArgentinaArmeniaAsiaAustraliaAustriaBahamasBangladeshBarbadosBelarusBelgiumBelizeBoliviaBosnia and HerzegovinaBrazilBulgariaBurma/MyanmarCabo VerdeCambodiaCameroonCanadaCaribbeanCentral AmericaChileChinaColombiaCongoCosta RicaCroatiaCubaCzechoslovakiaDenmarkDominicaDominican RepublicEastern AfricaEastern AsiaEastern EuropeEcuadorEgyptEl SalvadorEnglandEritreaEthiopiaEuropeFijiFranceGermanyGhanaGreeceGrenadaGuatemalaGuyanaHaitiHondurasHong KongHungaryIndiaIndonesiaIranIraqIrelandIsraelItalyJamaicaJapanJordanKazakhstanKenyaKoreaKuwaitLaosLatin AmericaLatviaLebanonLiberiaLithuaniaMalaysiaMexicoMicronesiaMiddle AfricaMoldovaMoroccoNepalNetherlandsNicaraguaNigeriaNorth AmericaNorth MacedoniaNorthern AfricaNorthern EuropeNorwayOceaniaPakistanPanamaPeruPhilippinesPolandPortugalRomaniaRussiaSaudi ArabiaScotlandSenegalSerbiaSierra LeoneSingaporeSomaliaSouth AfricaSouth AmericaSouth Central AsiaSouth Eastern AsiaSouthern EuropeSpainSri LankaSt. Vincent and the GrenadinesSudanSwedenSwitzerlandSyriaTaiwanThailandTrinidad and TobagoTurkeyUgandaUkraineUruguayUzbekistanVenezuelaVietnamWest IndiesWestern AfricaWestern AsiaWestern EuropeYemenZaireZimbabweAzores
Cambodian
Race
Ancestry
AfghanAfricanAlaska NativeAlaskan AthabascanAlbanianAleutAlsatianAmericanApacheArabArapahoArgentineanArmenianAssyrian/Chaldean/SyriacAustralianAustrianBahamianBangladeshiBarbadianBasqueBelgianBelizeanBermudanBhutaneseBlackfeetBolivianBrazilianBritishBritish West IndianBulgarianBurmeseCajunCambodianCanadianCape VerdeanCarpatho RusynCelticCentral AmericanCentral American IndianCherokeeCheyenneChickasawChileanChineseChippewaChoctawColombianColvilleComancheCosta RicanCreeCreekCroatianCrowCubanCypriotCzechCzechoslovakianDanishDelawareDominicanDutchDutch West IndianEastern EuropeanEcuadorianEnglishEstonianEthiopianEuropeanFijianFilipinoFinnishFrenchFrench American IndianFrench CanadianGermanGerman RussianGhanaianGreekGuamanian/ChamorroGuatemalanGuyaneseHaitianHmongHonduranHopiHoumaHungarianIcelanderIndian (Asian)IndonesianInupiatIranianIraqiIrishIroquoisIsraeliItalianJamaicanJapaneseJordanianKenyanKiowaKoreanLaotianLatvianLebaneseLiberianLithuanianLumbeeLuxembourgerMacedonianMalaysianMalteseMarshalleseMenomineeMexicanMexican American IndianMongolianMoroccanNative HawaiianNavajoNepaleseNew ZealanderNicaraguanNigerianNorthern EuropeanNorwegianOkinawanOsageOttawaPaiutePakistaniPalestinianPanamanianParaguayanPennsylvania GermanPeruvianPimaPolishPortuguesePotawatomiPuebloPuerto RicanPuget Sound SalishRomanianRussianSalvadoranSamoanScandinavianScotch-IrishScottishSeminoleSenegaleseSerbianShoshoneSierra LeoneanSiouxSlavicSlovakSloveneSomaliSouth AfricanSouth AmericanSouth American IndianSoviet UnionSpaniardSpanishSpanish AmericanSpanish American IndianSri LankanSubsaharan AfricanSudaneseSwedishSwissSyrianTaiwaneseThaiTlingit-HaidaTohono O'OdhamTonganTrinidadian and TobagonianTsimshianTurkishU.S. Virgin IslanderUgandanUkrainianUruguayanUteVenezuelanVietnameseWelshWest IndianYakamaYaquiYugoslavianYumanYup'ikZimbabwean
Immigration
NonimmigrantsImmigrantsAfghanistanAfricaAlbaniaArgentinaArmeniaAsiaAustraliaAustriaBahamasBangladeshBarbadosBelarusBelgiumBelizeBoliviaBosnia and HerzegovinaBrazilBulgariaBurma/MyanmarCabo VerdeCambodiaCameroonCanadaCaribbeanCentral AmericaChileChinaColombiaCongoCosta RicaCroatiaCubaCzechoslovakiaDenmarkDominicaDominican RepublicEastern AfricaEastern AsiaEastern EuropeEcuadorEgyptEl SalvadorEnglandEritreaEthiopiaEuropeFijiFranceGermanyGhanaGreeceGrenadaGuatemalaGuyanaHaitiHondurasHong KongHungaryIndiaIndonesiaIranIraqIrelandIsraelItalyJamaicaJapanJordanKazakhstanKenyaKoreaKuwaitLaosLatin AmericaLatviaLebanonLiberiaLithuaniaMalaysiaMexicoMicronesiaMiddle AfricaMoldovaMoroccoNepalNetherlandsNicaraguaNigeriaNorth AmericaNorth MacedoniaNorthern AfricaNorthern EuropeNorwayOceaniaPakistanPanamaPeruPhilippinesPolandPortugalRomaniaRussiaSaudi ArabiaScotlandSenegalSerbiaSierra LeoneSingaporeSomaliaSouth AfricaSouth AmericaSouth Central AsiaSouth Eastern AsiaSouthern EuropeSpainSri LankaSt. Vincent and the GrenadinesSudanSwedenSwitzerlandSyriaTaiwanThailandTrinidad and TobagoTurkeyUgandaUkraineUruguayUzbekistanVenezuelaVietnamWest IndiesWestern AfricaWestern AsiaWestern EuropeYemenZaireZimbabweAzores
Unemployment
Income
Poverty
Unemployment
Labor Participation
Family Structure
Vehicle Availability
Education Level
Disability

Unemployment Comparison

Egyptians

Cambodians

Good
Exceptional
5.2%
UNEMPLOYMENT
75.2/ 100
METRIC RATING
153rd/ 347
METRIC RANK
4.9%
UNEMPLOYMENT
99.0/ 100
METRIC RATING
61st/ 347
METRIC RANK

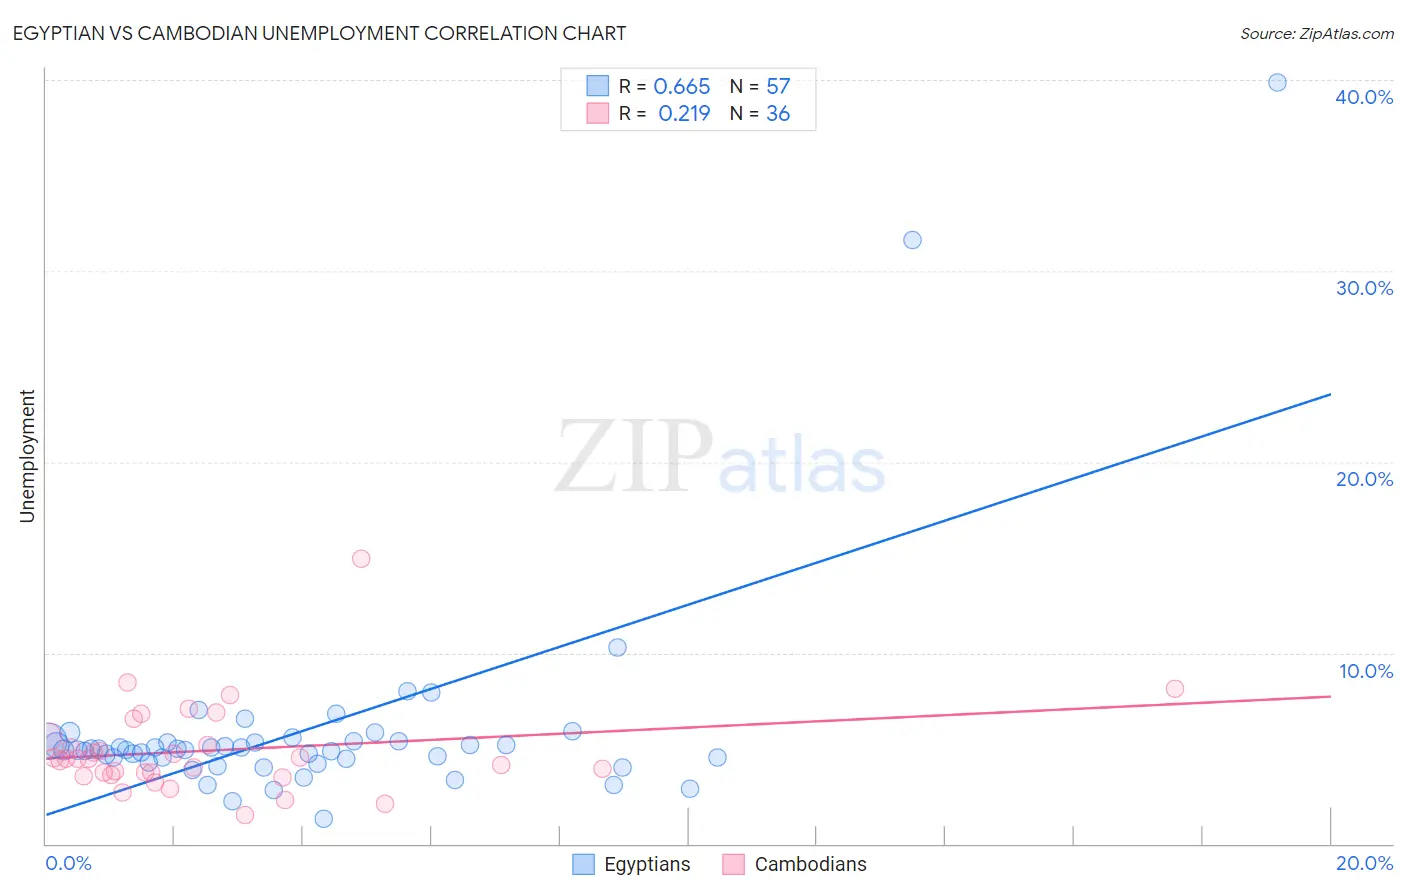
Egyptian vs Cambodian Unemployment Correlation Chart

The statistical analysis conducted on geographies consisting of 276,825,102 people shows a significant positive correlation between the proportion of Egyptians and unemployment in the United States with a correlation coefficient (R) of 0.665 and weighted average of 5.2%. Similarly, the statistical analysis conducted on geographies consisting of 102,491,878 people shows a weak positive correlation between the proportion of Cambodians and unemployment in the United States with a correlation coefficient (R) of 0.219 and weighted average of 4.9%, a difference of 5.7%.
Egyptian vs Cambodian Unemployment

Unemployment Correlation Summary

MeasurementEgyptianCambodian
Minimum1.3%1.5%
Maximum39.9%14.9%
Range38.6%13.4%
Mean6.0%4.9%
Median4.9%4.4%
Interquartile 25% (IQ1)4.4%3.6%
Interquartile 75% (IQ3)5.4%5.4%
Interquartile Range (IQR)1.0%1.8%
Standard Deviation (Sample)5.9%2.4%
Standard Deviation (Population)5.9%2.4%

Similar Demographics by Unemployment

Demographics Similar to Egyptians by Unemployment

In terms of unemployment, the demographic groups most similar to Egyptians are Immigrants from Hong Kong (5.2%, a difference of 0.0%), Immigrants from Eastern Europe (5.2%, a difference of 0.010%), Immigrants from China (5.2%, a difference of 0.040%), Potawatomi (5.2%, a difference of 0.080%), and Syrian (5.2%, a difference of 0.22%).
DemographicsRating | RankUnemployment
Immigrants | Asia
81.8
/100
|
#146
Excellent
5.1%
Indians (Asian)
81.6
/100
|
#147
Excellent
5.1%
Immigrants | Italy
79.1
/100
|
#148
Good
5.1%
Syrians
77.7
/100
|
#149
Good
5.2%
Potawatomi
76.2
/100
|
#150
Good
5.2%
Immigrants | Eastern Europe
75.3
/100
|
#151
Good
5.2%
Immigrants | Hong Kong
75.2
/100
|
#152
Good
5.2%
Egyptians
75.2
/100
|
#153
Good
5.2%
Immigrants | China
74.7
/100
|
#154
Good
5.2%
Immigrants | Northern Africa
71.3
/100
|
#155
Good
5.2%
Immigrants | Kazakhstan
70.4
/100
|
#156
Good
5.2%
Sri Lankans
69.5
/100
|
#157
Good
5.2%
Immigrants | Egypt
66.7
/100
|
#158
Good
5.2%
Immigrants | Russia
66.6
/100
|
#159
Good
5.2%
Laotians
66.3
/100
|
#160
Good
5.2%

Demographics Similar to Cambodians by Unemployment

In terms of unemployment, the demographic groups most similar to Cambodians are Immigrants from Netherlands (4.9%, a difference of 0.0%), Icelander (4.9%, a difference of 0.010%), Immigrants from Bulgaria (4.9%, a difference of 0.030%), Bhutanese (4.9%, a difference of 0.050%), and Greek (4.9%, a difference of 0.070%).
DemographicsRating | RankUnemployment
Eastern Europeans
99.2
/100
|
#54
Exceptional
4.9%
Australians
99.2
/100
|
#55
Exceptional
4.9%
Celtics
99.1
/100
|
#56
Exceptional
4.9%
Immigrants | Singapore
99.1
/100
|
#57
Exceptional
4.9%
Greeks
99.0
/100
|
#58
Exceptional
4.9%
Bhutanese
99.0
/100
|
#59
Exceptional
4.9%
Immigrants | Netherlands
99.0
/100
|
#60
Exceptional
4.9%
Cambodians
99.0
/100
|
#61
Exceptional
4.9%
Icelanders
98.9
/100
|
#62
Exceptional
4.9%
Immigrants | Bulgaria
98.9
/100
|
#63
Exceptional
4.9%
Italians
98.9
/100
|
#64
Exceptional
4.9%
Immigrants | Canada
98.8
/100
|
#65
Exceptional
4.9%
Slovaks
98.7
/100
|
#66
Exceptional
4.9%
New Zealanders
98.6
/100
|
#67
Exceptional
4.9%
Slavs
98.6
/100
|
#68
Exceptional
4.9%