Ecuadorian vs Senegalese Unemployment Among Ages 45 to 54 years
COMPARE
Ecuadorian
Senegalese
Unemployment Among Ages 45 to 54 years
Unemployment Among Ages 45 to 54 years Comparison
Ecuadorians
Senegalese
5.3%
UNEMPLOYMENT AMONG AGES 45 TO 54 YEARS
0.0/ 100
METRIC RATING
299th/ 347
METRIC RANK
5.1%
UNEMPLOYMENT AMONG AGES 45 TO 54 YEARS
0.0/ 100
METRIC RATING
286th/ 347
METRIC RANK
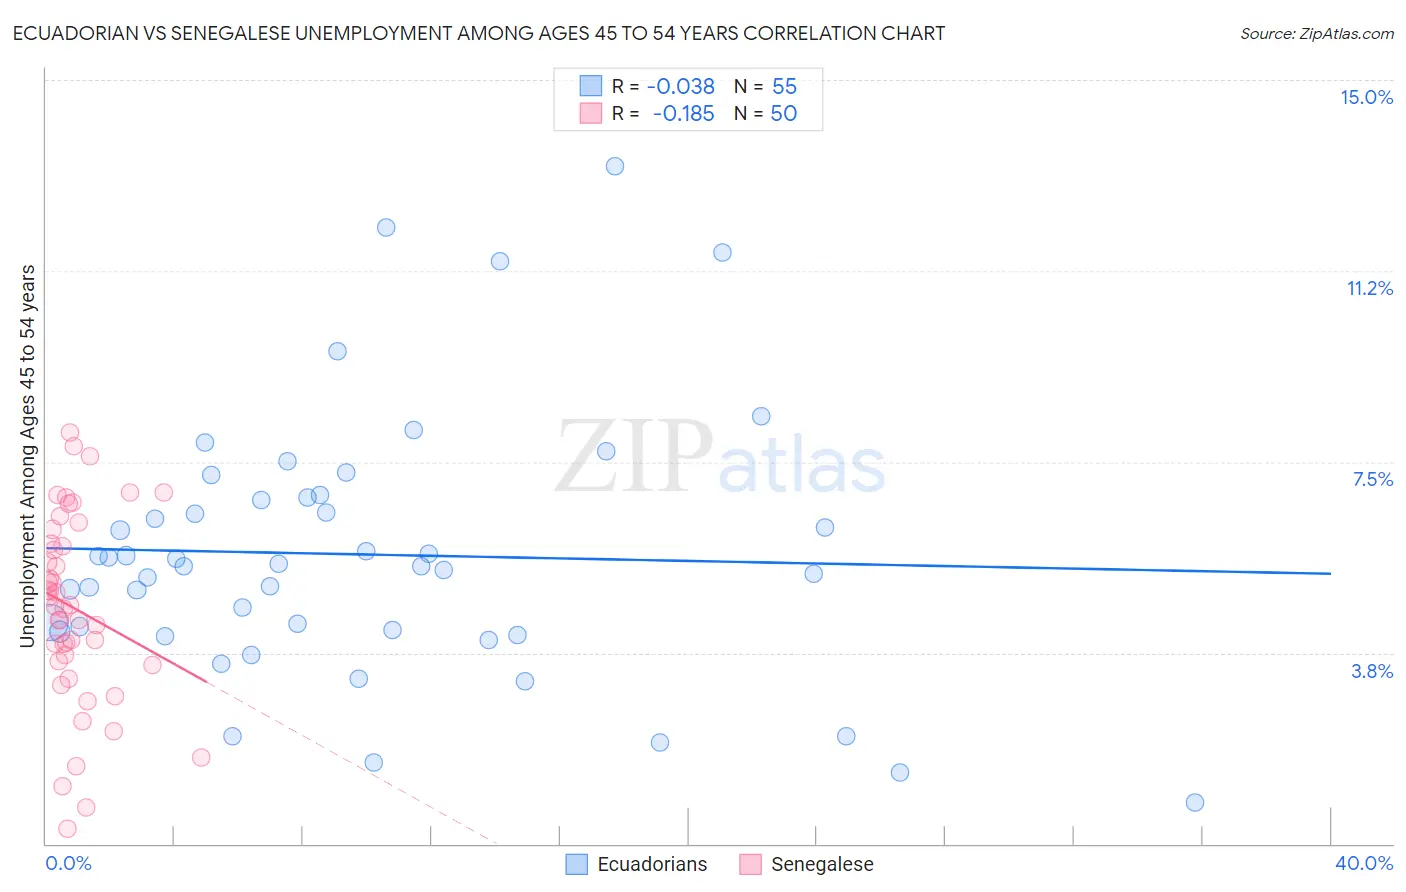
Ecuadorian vs Senegalese Unemployment Among Ages 45 to 54 years Correlation Chart
The statistical analysis conducted on geographies consisting of 312,530,580 people shows no correlation between the proportion of Ecuadorians and unemployment rate among population between the ages 45 and 54 in the United States with a correlation coefficient (R) of -0.038 and weighted average of 5.3%. Similarly, the statistical analysis conducted on geographies consisting of 77,807,393 people shows a poor negative correlation between the proportion of Senegalese and unemployment rate among population between the ages 45 and 54 in the United States with a correlation coefficient (R) of -0.185 and weighted average of 5.1%, a difference of 2.8%.
Unemployment Among Ages 45 to 54 years Correlation Summary
| Measurement | Ecuadorian | Senegalese |
| Minimum | 0.80% | 0.30% |
| Maximum | 13.3% | 8.1% |
| Range | 12.5% | 7.8% |
| Mean | 5.7% | 4.6% |
| Median | 5.4% | 4.7% |
| Interquartile 25% (IQ1) | 4.2% | 3.6% |
| Interquartile 75% (IQ3) | 6.8% | 5.9% |
| Interquartile Range (IQR) | 2.6% | 2.3% |
| Standard Deviation (Sample) | 2.6% | 1.8% |
| Standard Deviation (Population) | 2.6% | 1.8% |
Demographics Similar to Ecuadorians and Senegalese by Unemployment Among Ages 45 to 54 years
In terms of unemployment among ages 45 to 54 years, the demographic groups most similar to Ecuadorians are Immigrants from Trinidad and Tobago (5.3%, a difference of 0.020%), Aleut (5.3%, a difference of 0.14%), West Indian (5.3%, a difference of 0.14%), Central American Indian (5.3%, a difference of 0.21%), and Jamaican (5.3%, a difference of 0.33%). Similarly, the demographic groups most similar to Senegalese are Iroquois (5.1%, a difference of 0.16%), Kiowa (5.1%, a difference of 0.18%), Hispanic or Latino (5.1%, a difference of 0.83%), Haitian (5.2%, a difference of 0.83%), and Immigrants from Caribbean (5.2%, a difference of 0.91%).
| Demographics | Rating | Rank | Unemployment Among Ages 45 to 54 years |
| Africans | 0.0 /100 | #282 | Tragic 5.1% |
| Hispanics or Latinos | 0.0 /100 | #283 | Tragic 5.1% |
| Kiowa | 0.0 /100 | #284 | Tragic 5.1% |
| Iroquois | 0.0 /100 | #285 | Tragic 5.1% |
| Senegalese | 0.0 /100 | #286 | Tragic 5.1% |
| Haitians | 0.0 /100 | #287 | Tragic 5.2% |
| Immigrants | Caribbean | 0.0 /100 | #288 | Tragic 5.2% |
| Immigrants | Haiti | 0.0 /100 | #289 | Tragic 5.2% |
| Immigrants | Portugal | 0.0 /100 | #290 | Tragic 5.2% |
| Armenians | 0.0 /100 | #291 | Tragic 5.2% |
| Trinidadians and Tobagonians | 0.0 /100 | #292 | Tragic 5.2% |
| Immigrants | Senegal | 0.0 /100 | #293 | Tragic 5.2% |
| Belizeans | 0.0 /100 | #294 | Tragic 5.2% |
| Jamaicans | 0.0 /100 | #295 | Tragic 5.3% |
| Aleuts | 0.0 /100 | #296 | Tragic 5.3% |
| West Indians | 0.0 /100 | #297 | Tragic 5.3% |
| Immigrants | Trinidad and Tobago | 0.0 /100 | #298 | Tragic 5.3% |
| Ecuadorians | 0.0 /100 | #299 | Tragic 5.3% |
| Central American Indians | 0.0 /100 | #300 | Tragic 5.3% |
| Menominee | 0.0 /100 | #301 | Tragic 5.3% |
| Immigrants | Ecuador | 0.0 /100 | #302 | Tragic 5.3% |