Ecuadorian vs Immigrants from Switzerland Unemployment Among Ages 20 to 24 years

COMPARE

Ecuadorian
Race
Ancestry
AfghanAfricanAlaska NativeAlaskan AthabascanAlbanianAleutAlsatianAmericanApacheArabArapahoArgentineanArmenianAssyrian/Chaldean/SyriacAustralianAustrianBahamianBangladeshiBarbadianBasqueBelgianBelizeanBermudanBhutaneseBlackfeetBolivianBrazilianBritishBritish West IndianBulgarianBurmeseCajunCambodianCanadianCape VerdeanCarpatho RusynCelticCentral AmericanCentral American IndianCherokeeCheyenneChickasawChileanChineseChippewaChoctawColombianColvilleComancheCosta RicanCreeCreekCroatianCrowCubanCypriotCzechCzechoslovakianDanishDelawareDominicanDutchDutch West IndianEastern EuropeanEcuadorianEgyptianEnglishEstonianEthiopianEuropeanFijianFilipinoFinnishFrenchFrench American IndianFrench CanadianGermanGerman RussianGhanaianGreekGuamanian/ChamorroGuatemalanGuyaneseHaitianHmongHonduranHopiHoumaHungarianIcelanderIndian (Asian)IndonesianInupiatIranianIraqiIrishIroquoisIsraeliItalianJamaicanJapaneseJordanianKenyanKiowaKoreanLaotianLatvianLebaneseLiberianLithuanianLumbeeLuxembourgerMacedonianMalaysianMalteseMarshalleseMenomineeMexicanMexican American IndianMongolianMoroccanNative HawaiianNavajoNepaleseNew ZealanderNicaraguanNigerianNorthern EuropeanNorwegianOkinawanOsageOttawaPaiutePakistaniPalestinianPanamanianParaguayanPennsylvania GermanPeruvianPimaPolishPortuguesePotawatomiPuebloPuerto RicanPuget Sound SalishRomanianRussianSalvadoranSamoanScandinavianScotch-IrishScottishSeminoleSenegaleseSerbianShoshoneSierra LeoneanSiouxSlavicSlovakSloveneSomaliSouth AfricanSouth AmericanSouth American IndianSoviet UnionSpaniardSpanishSpanish AmericanSpanish American IndianSri LankanSubsaharan AfricanSudaneseSwedishSwissSyrianTaiwaneseThaiTlingit-HaidaTohono O'OdhamTonganTrinidadian and TobagonianTsimshianTurkishU.S. Virgin IslanderUgandanUkrainianUruguayanUteVenezuelanVietnameseWelshWest IndianYakamaYaquiYugoslavianYumanYup'ikZimbabwean
Immigration
NonimmigrantsImmigrantsAfghanistanAfricaAlbaniaArgentinaArmeniaAsiaAustraliaAustriaBahamasBangladeshBarbadosBelarusBelgiumBelizeBoliviaBosnia and HerzegovinaBrazilBulgariaBurma/MyanmarCabo VerdeCambodiaCameroonCanadaCaribbeanCentral AmericaChileChinaColombiaCongoCosta RicaCroatiaCubaCzechoslovakiaDenmarkDominicaDominican RepublicEastern AfricaEastern AsiaEastern EuropeEcuadorEgyptEl SalvadorEnglandEritreaEthiopiaEuropeFijiFranceGermanyGhanaGreeceGrenadaGuatemalaGuyanaHaitiHondurasHong KongHungaryIndiaIndonesiaIranIraqIrelandIsraelItalyJamaicaJapanJordanKazakhstanKenyaKoreaKuwaitLaosLatin AmericaLatviaLebanonLiberiaLithuaniaMalaysiaMexicoMicronesiaMiddle AfricaMoldovaMoroccoNepalNetherlandsNicaraguaNigeriaNorth AmericaNorth MacedoniaNorthern AfricaNorthern EuropeNorwayOceaniaPakistanPanamaPeruPhilippinesPolandPortugalRomaniaRussiaSaudi ArabiaScotlandSenegalSerbiaSierra LeoneSingaporeSomaliaSouth AfricaSouth AmericaSouth Central AsiaSouth Eastern AsiaSouthern EuropeSpainSri LankaSt. Vincent and the GrenadinesSudanSwedenSyriaTaiwanThailandTrinidad and TobagoTurkeyUgandaUkraineUruguayUzbekistanVenezuelaVietnamWest IndiesWestern AfricaWestern AsiaWestern EuropeYemenZaireZimbabweAzores
Immigrants from Switzerland
Race
Ancestry
AfghanAfricanAlaska NativeAlaskan AthabascanAlbanianAleutAlsatianAmericanApacheArabArapahoArgentineanArmenianAssyrian/Chaldean/SyriacAustralianAustrianBahamianBangladeshiBarbadianBasqueBelgianBelizeanBermudanBhutaneseBlackfeetBolivianBrazilianBritishBritish West IndianBulgarianBurmeseCajunCambodianCanadianCape VerdeanCarpatho RusynCelticCentral AmericanCentral American IndianCherokeeCheyenneChickasawChileanChineseChippewaChoctawColombianColvilleComancheCosta RicanCreeCreekCroatianCrowCubanCypriotCzechCzechoslovakianDanishDelawareDominicanDutchDutch West IndianEastern EuropeanEgyptianEnglishEstonianEthiopianEuropeanFijianFilipinoFinnishFrenchFrench American IndianFrench CanadianGermanGerman RussianGhanaianGreekGuamanian/ChamorroGuatemalanGuyaneseHaitianHmongHonduranHopiHoumaHungarianIcelanderIndian (Asian)IndonesianInupiatIranianIraqiIrishIroquoisIsraeliItalianJamaicanJapaneseJordanianKenyanKiowaKoreanLaotianLatvianLebaneseLiberianLithuanianLumbeeLuxembourgerMacedonianMalaysianMalteseMarshalleseMenomineeMexicanMexican American IndianMongolianMoroccanNative HawaiianNavajoNepaleseNew ZealanderNicaraguanNigerianNorthern EuropeanNorwegianOkinawanOsageOttawaPaiutePakistaniPalestinianPanamanianParaguayanPennsylvania GermanPeruvianPimaPolishPortuguesePotawatomiPuebloPuerto RicanPuget Sound SalishRomanianRussianSalvadoranSamoanScandinavianScotch-IrishScottishSeminoleSenegaleseSerbianShoshoneSierra LeoneanSiouxSlavicSlovakSloveneSomaliSouth AfricanSouth AmericanSouth American IndianSoviet UnionSpaniardSpanishSpanish AmericanSpanish American IndianSri LankanSubsaharan AfricanSudaneseSwedishSwissSyrianTaiwaneseThaiTlingit-HaidaTohono O'OdhamTonganTrinidadian and TobagonianTsimshianTurkishU.S. Virgin IslanderUgandanUkrainianUruguayanUteVenezuelanVietnameseWelshWest IndianYakamaYaquiYugoslavianYumanYup'ikZimbabwean
Immigration
NonimmigrantsImmigrantsAfghanistanAfricaAlbaniaArgentinaArmeniaAsiaAustraliaAustriaBahamasBangladeshBarbadosBelarusBelgiumBelizeBoliviaBosnia and HerzegovinaBrazilBulgariaBurma/MyanmarCabo VerdeCambodiaCameroonCanadaCaribbeanCentral AmericaChileChinaColombiaCongoCosta RicaCroatiaCubaCzechoslovakiaDenmarkDominicaDominican RepublicEastern AfricaEastern AsiaEastern EuropeEcuadorEgyptEl SalvadorEnglandEritreaEthiopiaEuropeFijiFranceGermanyGhanaGreeceGrenadaGuatemalaGuyanaHaitiHondurasHong KongHungaryIndiaIndonesiaIranIraqIrelandIsraelItalyJamaicaJapanJordanKazakhstanKenyaKoreaKuwaitLaosLatin AmericaLatviaLebanonLiberiaLithuaniaMalaysiaMexicoMicronesiaMiddle AfricaMoldovaMoroccoNepalNetherlandsNicaraguaNigeriaNorth AmericaNorth MacedoniaNorthern AfricaNorthern EuropeNorwayOceaniaPakistanPanamaPeruPhilippinesPolandPortugalRomaniaRussiaSaudi ArabiaScotlandSenegalSerbiaSierra LeoneSingaporeSomaliaSouth AfricaSouth AmericaSouth Central AsiaSouth Eastern AsiaSouthern EuropeSpainSri LankaSt. Vincent and the GrenadinesSudanSwedenSwitzerlandSyriaTaiwanThailandTrinidad and TobagoTurkeyUgandaUkraineUruguayUzbekistanVenezuelaVietnamWest IndiesWestern AfricaWestern AsiaWestern EuropeYemenZaireZimbabweAzores
Unemployment Among Ages 20 to 24 years
Income
Poverty
Unemployment
Labor Participation
Family Structure
Vehicle Availability
Education Level
Disability

Unemployment Among Ages 20 to 24 years Comparison

Ecuadorians

Immigrants from Switzerland

Tragic
Good
11.8%
UNEMPLOYMENT AMONG AGES 20 TO 24 YEARS
0.0/ 100
METRIC RATING
286th/ 347
METRIC RANK
10.2%
UNEMPLOYMENT AMONG AGES 20 TO 24 YEARS
71.3/ 100
METRIC RATING
154th/ 347
METRIC RANK

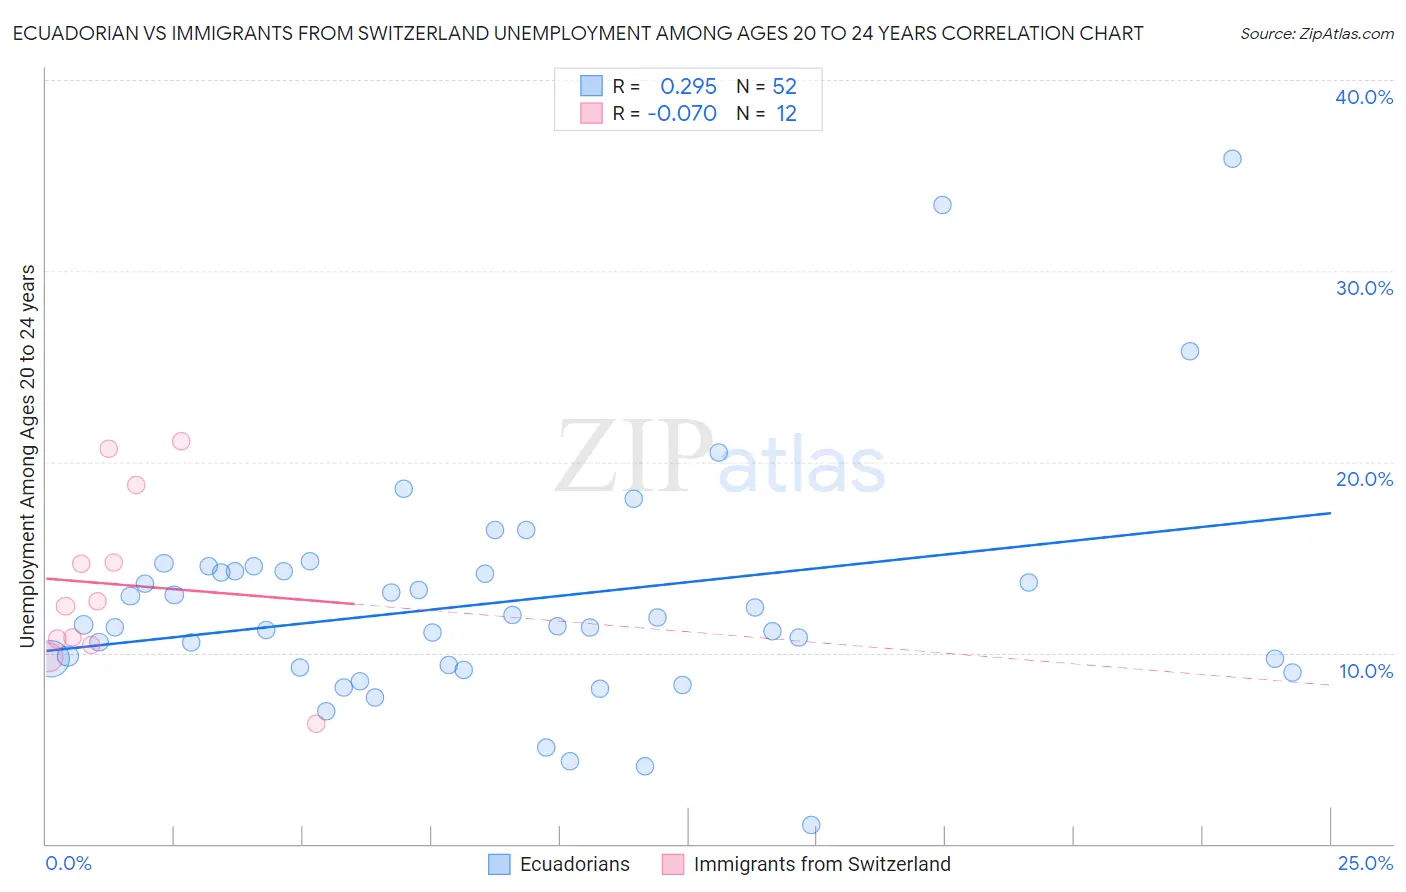
Ecuadorian vs Immigrants from Switzerland Unemployment Among Ages 20 to 24 years Correlation Chart

The statistical analysis conducted on geographies consisting of 311,775,380 people shows a weak positive correlation between the proportion of Ecuadorians and unemployment rate among population between the ages 20 and 24 in the United States with a correlation coefficient (R) of 0.295 and weighted average of 11.8%. Similarly, the statistical analysis conducted on geographies consisting of 145,729,858 people shows a slight negative correlation between the proportion of Immigrants from Switzerland and unemployment rate among population between the ages 20 and 24 in the United States with a correlation coefficient (R) of -0.070 and weighted average of 10.2%, a difference of 15.0%.
Ecuadorian vs Immigrants from Switzerland Unemployment Among Ages 20 to 24 years

Unemployment Among Ages 20 to 24 years Correlation Summary

MeasurementEcuadorianImmigrants from Switzerland
Minimum1.0%6.3%
Maximum35.9%21.1%
Range34.9%14.8%
Mean12.6%13.6%
Median11.4%12.6%
Interquartile 25% (IQ1)9.3%10.5%
Interquartile 75% (IQ3)14.3%16.8%
Interquartile Range (IQR)5.0%6.2%
Standard Deviation (Sample)6.1%4.6%
Standard Deviation (Population)6.0%4.4%

Similar Demographics by Unemployment Among Ages 20 to 24 years

Demographics Similar to Ecuadorians by Unemployment Among Ages 20 to 24 years

In terms of unemployment among ages 20 to 24 years, the demographic groups most similar to Ecuadorians are Immigrants from Ecuador (11.8%, a difference of 0.090%), Soviet Union (11.7%, a difference of 0.12%), U.S. Virgin Islander (11.8%, a difference of 0.14%), Immigrants from Western Africa (11.7%, a difference of 0.16%), and Ghanaian (11.7%, a difference of 0.17%).
DemographicsRating | RankUnemployment Among Ages 20 to 24 years
Bahamians
0.0
/100
|
#279
Tragic
11.6%
Alaskan Athabascans
0.0
/100
|
#280
Tragic
11.6%
Armenians
0.0
/100
|
#281
Tragic
11.7%
Immigrants | Cameroon
0.0
/100
|
#282
Tragic
11.7%
Ghanaians
0.0
/100
|
#283
Tragic
11.7%
Immigrants | Western Africa
0.0
/100
|
#284
Tragic
11.7%
Soviet Union
0.0
/100
|
#285
Tragic
11.7%
Ecuadorians
0.0
/100
|
#286
Tragic
11.8%
Immigrants | Ecuador
0.0
/100
|
#287
Tragic
11.8%
U.S. Virgin Islanders
0.0
/100
|
#288
Tragic
11.8%
Belizeans
0.0
/100
|
#289
Tragic
11.8%
Immigrants | Caribbean
0.0
/100
|
#290
Tragic
11.8%
Central American Indians
0.0
/100
|
#291
Tragic
11.9%
Immigrants | Senegal
0.0
/100
|
#292
Tragic
11.9%
Immigrants | Ghana
0.0
/100
|
#293
Tragic
11.9%

Demographics Similar to Immigrants from Switzerland by Unemployment Among Ages 20 to 24 years

In terms of unemployment among ages 20 to 24 years, the demographic groups most similar to Immigrants from Switzerland are Immigrants from Taiwan (10.2%, a difference of 0.010%), Iranian (10.2%, a difference of 0.050%), Lithuanian (10.2%, a difference of 0.060%), Immigrants from South Africa (10.2%, a difference of 0.11%), and Immigrants from Scotland (10.2%, a difference of 0.15%).
DemographicsRating | RankUnemployment Among Ages 20 to 24 years
French Canadians
77.5
/100
|
#147
Good
10.2%
Immigrants | Romania
75.7
/100
|
#148
Good
10.2%
Immigrants | Scotland
74.6
/100
|
#149
Good
10.2%
Hungarians
74.4
/100
|
#150
Good
10.2%
Immigrants | South Africa
73.6
/100
|
#151
Good
10.2%
Iranians
72.4
/100
|
#152
Good
10.2%
Immigrants | Taiwan
71.4
/100
|
#153
Good
10.2%
Immigrants | Switzerland
71.3
/100
|
#154
Good
10.2%
Lithuanians
70.0
/100
|
#155
Good
10.2%
Canadians
66.7
/100
|
#156
Good
10.2%
Immigrants | Uganda
65.6
/100
|
#157
Good
10.2%
Immigrants | Kazakhstan
65.5
/100
|
#158
Good
10.2%
Immigrants | England
63.7
/100
|
#159
Good
10.3%
Spaniards
63.4
/100
|
#160
Good
10.3%
Indians (Asian)
62.6
/100
|
#161
Good
10.3%