Ecuadorian vs Immigrants from Hong Kong Unemployment
COMPARE
Ecuadorian
Immigrants from Hong Kong
Unemployment
Unemployment Comparison
Ecuadorians
Immigrants from Hong Kong
6.2%
UNEMPLOYMENT
0.0/ 100
METRIC RATING
288th/ 347
METRIC RANK
5.2%
UNEMPLOYMENT
75.2/ 100
METRIC RATING
152nd/ 347
METRIC RANK
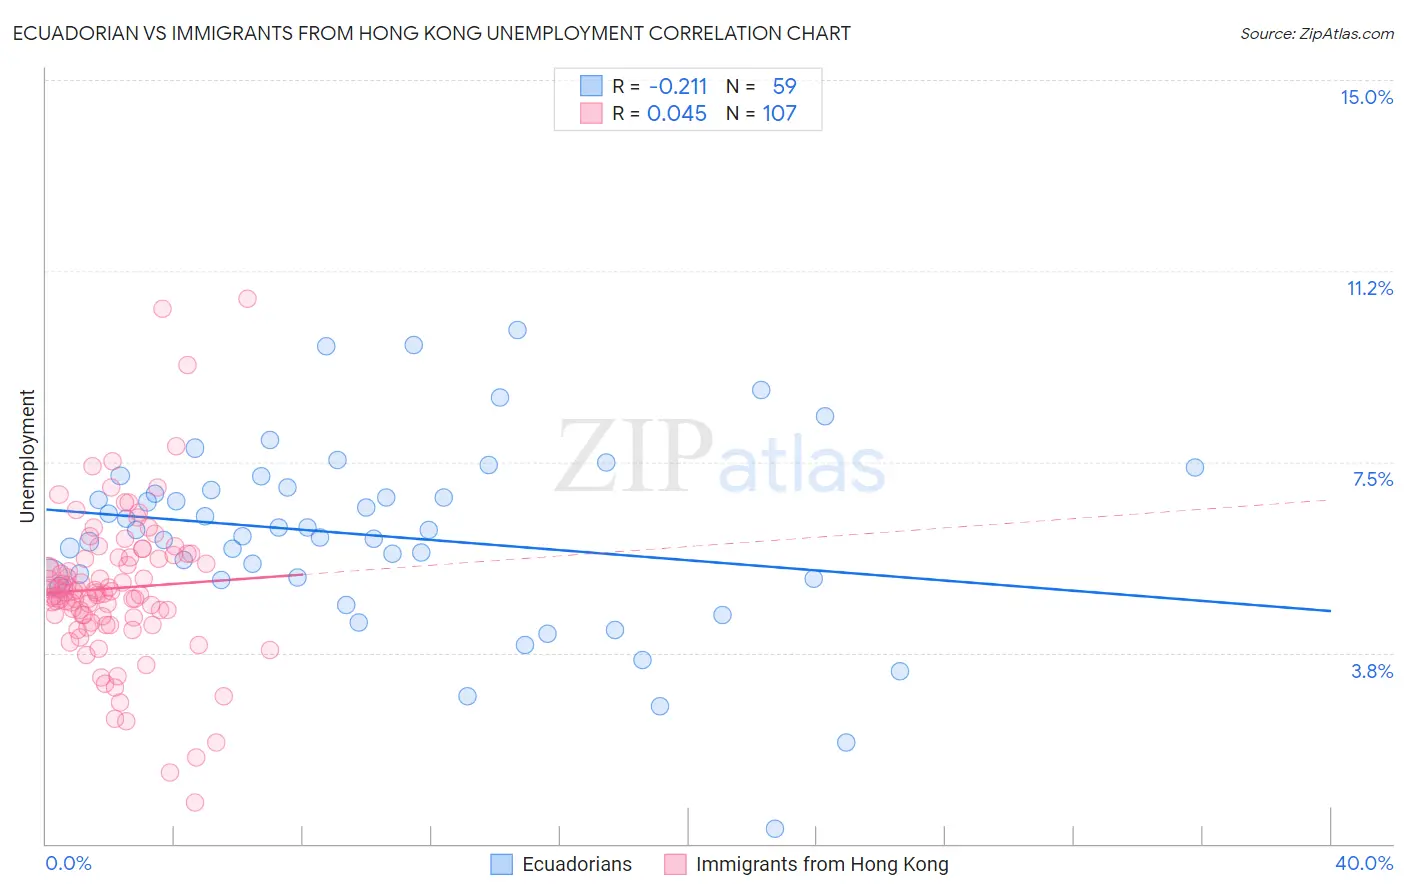
Ecuadorian vs Immigrants from Hong Kong Unemployment Correlation Chart
The statistical analysis conducted on geographies consisting of 317,664,443 people shows a weak negative correlation between the proportion of Ecuadorians and unemployment in the United States with a correlation coefficient (R) of -0.211 and weighted average of 6.2%. Similarly, the statistical analysis conducted on geographies consisting of 253,937,877 people shows no correlation between the proportion of Immigrants from Hong Kong and unemployment in the United States with a correlation coefficient (R) of 0.045 and weighted average of 5.2%, a difference of 19.5%.
Unemployment Correlation Summary
| Measurement | Ecuadorian | Immigrants from Hong Kong |
| Minimum | 0.30% | 0.80% |
| Maximum | 10.1% | 10.7% |
| Range | 9.8% | 9.9% |
| Mean | 6.0% | 5.0% |
| Median | 6.2% | 4.9% |
| Interquartile 25% (IQ1) | 5.2% | 4.4% |
| Interquartile 75% (IQ3) | 7.0% | 5.6% |
| Interquartile Range (IQR) | 1.8% | 1.2% |
| Standard Deviation (Sample) | 1.8% | 1.5% |
| Standard Deviation (Population) | 1.8% | 1.5% |
Similar Demographics by Unemployment
Demographics Similar to Ecuadorians by Unemployment
In terms of unemployment, the demographic groups most similar to Ecuadorians are Nepalese (6.2%, a difference of 0.030%), Chippewa (6.2%, a difference of 0.35%), Immigrants from Caribbean (6.2%, a difference of 0.36%), Senegalese (6.2%, a difference of 0.44%), and Immigrants from Senegal (6.1%, a difference of 0.79%).
| Demographics | Rating | Rank | Unemployment |
| Africans | 0.0 /100 | #281 | Tragic 6.1% |
| Immigrants | Azores | 0.0 /100 | #282 | Tragic 6.1% |
| Immigrants | Ghana | 0.0 /100 | #283 | Tragic 6.1% |
| Aleuts | 0.0 /100 | #284 | Tragic 6.1% |
| Immigrants | Senegal | 0.0 /100 | #285 | Tragic 6.1% |
| Immigrants | Caribbean | 0.0 /100 | #286 | Tragic 6.2% |
| Nepalese | 0.0 /100 | #287 | Tragic 6.2% |
| Ecuadorians | 0.0 /100 | #288 | Tragic 6.2% |
| Chippewa | 0.0 /100 | #289 | Tragic 6.2% |
| Senegalese | 0.0 /100 | #290 | Tragic 6.2% |
| Haitians | 0.0 /100 | #291 | Tragic 6.2% |
| Central American Indians | 0.0 /100 | #292 | Tragic 6.2% |
| Immigrants | Ecuador | 0.0 /100 | #293 | Tragic 6.2% |
| Spanish American Indians | 0.0 /100 | #294 | Tragic 6.2% |
| U.S. Virgin Islanders | 0.0 /100 | #295 | Tragic 6.3% |
Demographics Similar to Immigrants from Hong Kong by Unemployment
In terms of unemployment, the demographic groups most similar to Immigrants from Hong Kong are Egyptian (5.2%, a difference of 0.0%), Immigrants from Eastern Europe (5.2%, a difference of 0.010%), Immigrants from China (5.2%, a difference of 0.040%), Potawatomi (5.2%, a difference of 0.080%), and Syrian (5.2%, a difference of 0.22%).
| Demographics | Rating | Rank | Unemployment |
| Immigrants | Norway | 81.8 /100 | #145 | Excellent 5.1% |
| Immigrants | Asia | 81.8 /100 | #146 | Excellent 5.1% |
| Indians (Asian) | 81.6 /100 | #147 | Excellent 5.1% |
| Immigrants | Italy | 79.1 /100 | #148 | Good 5.1% |
| Syrians | 77.7 /100 | #149 | Good 5.2% |
| Potawatomi | 76.2 /100 | #150 | Good 5.2% |
| Immigrants | Eastern Europe | 75.3 /100 | #151 | Good 5.2% |
| Immigrants | Hong Kong | 75.2 /100 | #152 | Good 5.2% |
| Egyptians | 75.2 /100 | #153 | Good 5.2% |
| Immigrants | China | 74.7 /100 | #154 | Good 5.2% |
| Immigrants | Northern Africa | 71.3 /100 | #155 | Good 5.2% |
| Immigrants | Kazakhstan | 70.4 /100 | #156 | Good 5.2% |
| Sri Lankans | 69.5 /100 | #157 | Good 5.2% |
| Immigrants | Egypt | 66.7 /100 | #158 | Good 5.2% |
| Immigrants | Russia | 66.6 /100 | #159 | Good 5.2% |