Ecuadorian vs Cambodian Unemployment Among Seniors over 65 years
COMPARE
Ecuadorian
Cambodian
Unemployment Among Seniors over 65 years
Unemployment Among Seniors over 65 years Comparison
Ecuadorians
Cambodians
5.6%
UNEMPLOYMENT AMONG SENIORS OVER 65 YEARS
0.0/ 100
METRIC RATING
306th/ 347
METRIC RANK
4.8%
UNEMPLOYMENT AMONG SENIORS OVER 65 YEARS
100.0/ 100
METRIC RATING
36th/ 347
METRIC RANK
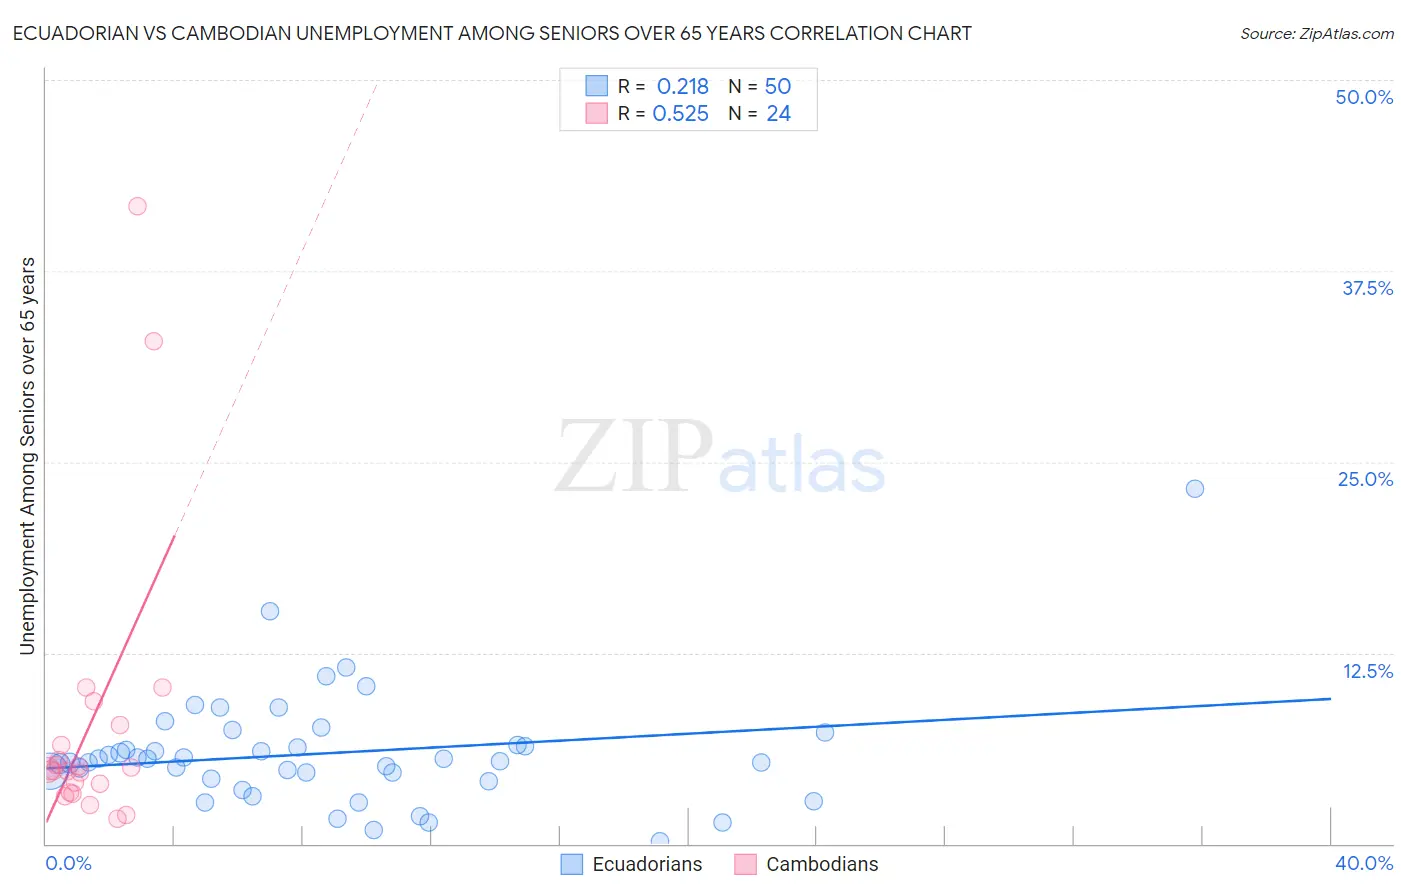
Ecuadorian vs Cambodian Unemployment Among Seniors over 65 years Correlation Chart
The statistical analysis conducted on geographies consisting of 294,826,024 people shows a weak positive correlation between the proportion of Ecuadorians and unemployment rate amomg seniors over the age of 65 in the United States with a correlation coefficient (R) of 0.218 and weighted average of 5.6%. Similarly, the statistical analysis conducted on geographies consisting of 99,515,098 people shows a substantial positive correlation between the proportion of Cambodians and unemployment rate amomg seniors over the age of 65 in the United States with a correlation coefficient (R) of 0.525 and weighted average of 4.8%, a difference of 15.9%.
Unemployment Among Seniors over 65 years Correlation Summary
| Measurement | Ecuadorian | Cambodian |
| Minimum | 0.20% | 1.6% |
| Maximum | 23.2% | 41.7% |
| Range | 23.0% | 40.1% |
| Mean | 5.9% | 7.8% |
| Median | 5.5% | 4.8% |
| Interquartile 25% (IQ1) | 4.2% | 3.6% |
| Interquartile 75% (IQ3) | 6.5% | 7.1% |
| Interquartile Range (IQR) | 2.3% | 3.5% |
| Standard Deviation (Sample) | 3.8% | 9.5% |
| Standard Deviation (Population) | 3.7% | 9.3% |
Similar Demographics by Unemployment Among Seniors over 65 years
Demographics Similar to Ecuadorians by Unemployment Among Seniors over 65 years
In terms of unemployment among seniors over 65 years, the demographic groups most similar to Ecuadorians are Mexican (5.6%, a difference of 0.040%), Portuguese (5.6%, a difference of 0.050%), Immigrants from St. Vincent and the Grenadines (5.6%, a difference of 0.14%), Liberian (5.6%, a difference of 0.21%), and Immigrants from Latin America (5.6%, a difference of 0.28%).
| Demographics | Rating | Rank | Unemployment Among Seniors over 65 years |
| Guyanese | 0.0 /100 | #299 | Tragic 5.6% |
| Zimbabweans | 0.0 /100 | #300 | Tragic 5.6% |
| Hispanics or Latinos | 0.0 /100 | #301 | Tragic 5.6% |
| Guatemalans | 0.0 /100 | #302 | Tragic 5.6% |
| Immigrants | Latin America | 0.0 /100 | #303 | Tragic 5.6% |
| Liberians | 0.0 /100 | #304 | Tragic 5.6% |
| Mexicans | 0.0 /100 | #305 | Tragic 5.6% |
| Ecuadorians | 0.0 /100 | #306 | Tragic 5.6% |
| Portuguese | 0.0 /100 | #307 | Tragic 5.6% |
| Immigrants | St. Vincent and the Grenadines | 0.0 /100 | #308 | Tragic 5.6% |
| Immigrants | Guatemala | 0.0 /100 | #309 | Tragic 5.6% |
| Salvadorans | 0.0 /100 | #310 | Tragic 5.6% |
| Immigrants | Guyana | 0.0 /100 | #311 | Tragic 5.6% |
| Immigrants | Ecuador | 0.0 /100 | #312 | Tragic 5.6% |
| Barbadians | 0.0 /100 | #313 | Tragic 5.6% |
Demographics Similar to Cambodians by Unemployment Among Seniors over 65 years
In terms of unemployment among seniors over 65 years, the demographic groups most similar to Cambodians are Bulgarian (4.8%, a difference of 0.020%), Immigrants from India (4.8%, a difference of 0.080%), Macedonian (4.8%, a difference of 0.11%), Immigrants from Kuwait (4.8%, a difference of 0.14%), and Bhutanese (4.8%, a difference of 0.15%).
| Demographics | Rating | Rank | Unemployment Among Seniors over 65 years |
| Immigrants | North Macedonia | 100.0 /100 | #29 | Exceptional 4.8% |
| Belgians | 100.0 /100 | #30 | Exceptional 4.8% |
| Immigrants | Uganda | 100.0 /100 | #31 | Exceptional 4.8% |
| Slovenes | 100.0 /100 | #32 | Exceptional 4.8% |
| Palestinians | 100.0 /100 | #33 | Exceptional 4.8% |
| Bhutanese | 100.0 /100 | #34 | Exceptional 4.8% |
| Immigrants | Kuwait | 100.0 /100 | #35 | Exceptional 4.8% |
| Cambodians | 100.0 /100 | #36 | Exceptional 4.8% |
| Bulgarians | 99.9 /100 | #37 | Exceptional 4.8% |
| Immigrants | India | 99.9 /100 | #38 | Exceptional 4.8% |
| Macedonians | 99.9 /100 | #39 | Exceptional 4.8% |
| Immigrants | Sweden | 99.9 /100 | #40 | Exceptional 4.8% |
| Kiowa | 99.9 /100 | #41 | Exceptional 4.8% |
| Swiss | 99.9 /100 | #42 | Exceptional 4.8% |
| Luxembourgers | 99.9 /100 | #43 | Exceptional 4.8% |