Eastern European vs Nonimmigrants Unemployment Among Ages 16 to 19 years
COMPARE
Eastern European
Nonimmigrants
Unemployment Among Ages 16 to 19 years
Unemployment Among Ages 16 to 19 years Comparison
Eastern Europeans
Nonimmigrants
17.6%
UNEMPLOYMENT AMONG AGES 16 TO 19 YEARS
44.3/ 100
METRIC RATING
184th/ 347
METRIC RANK
17.9%
UNEMPLOYMENT AMONG AGES 16 TO 19 YEARS
20.9/ 100
METRIC RATING
204th/ 347
METRIC RANK
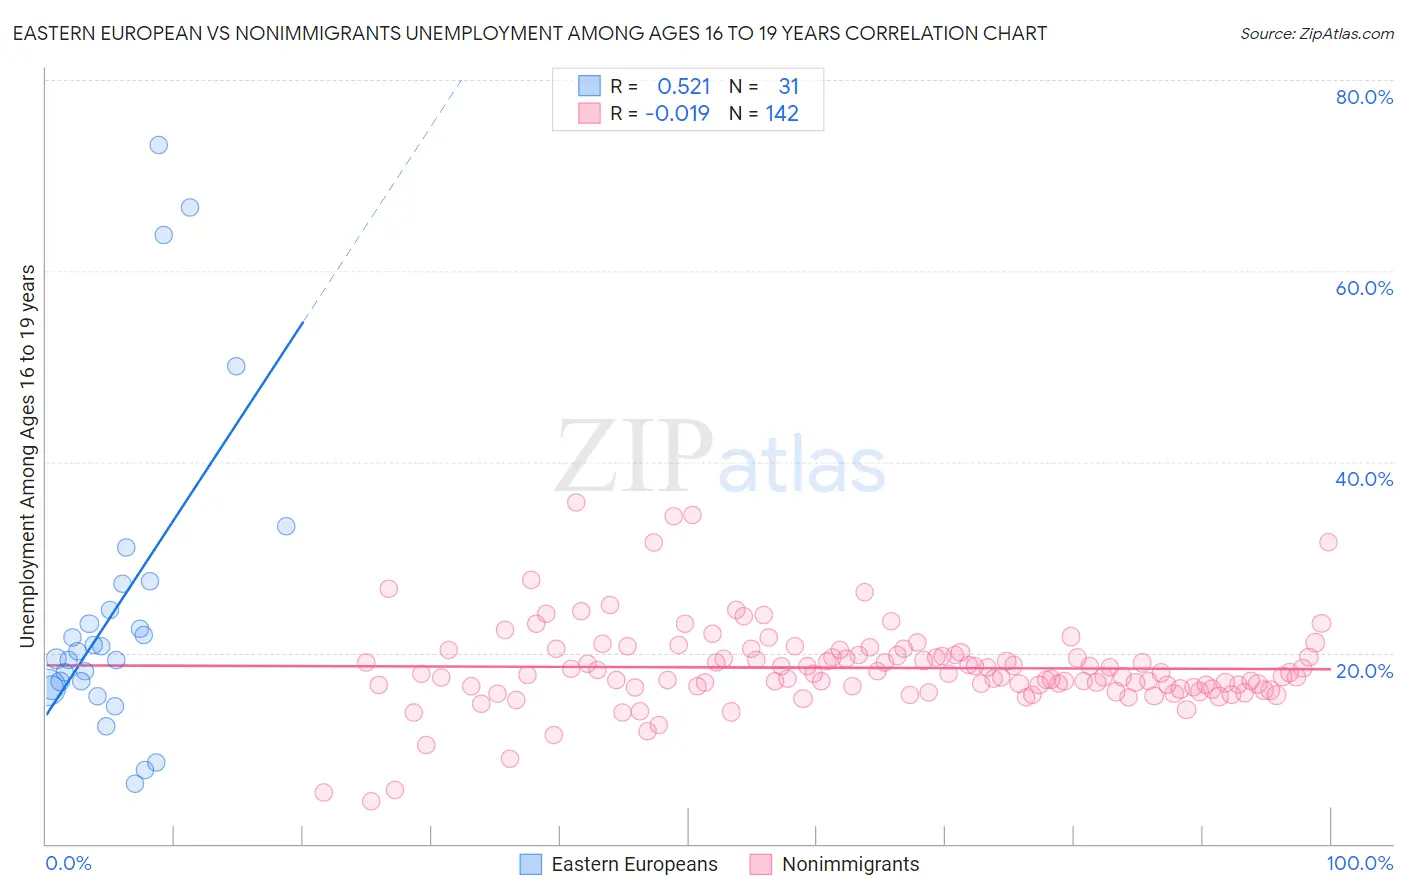
Eastern European vs Nonimmigrants Unemployment Among Ages 16 to 19 years Correlation Chart
The statistical analysis conducted on geographies consisting of 427,327,922 people shows a substantial positive correlation between the proportion of Eastern Europeans and unemployment rate among population between the ages 16 and 19 in the United States with a correlation coefficient (R) of 0.521 and weighted average of 17.6%. Similarly, the statistical analysis conducted on geographies consisting of 514,861,282 people shows no correlation between the proportion of Nonimmigrants and unemployment rate among population between the ages 16 and 19 in the United States with a correlation coefficient (R) of -0.019 and weighted average of 17.9%, a difference of 1.3%.
Unemployment Among Ages 16 to 19 years Correlation Summary
| Measurement | Eastern European | Nonimmigrants |
| Minimum | 6.2% | 4.5% |
| Maximum | 73.2% | 35.7% |
| Range | 67.0% | 31.2% |
| Mean | 24.9% | 18.4% |
| Median | 20.1% | 17.7% |
| Interquartile 25% (IQ1) | 16.4% | 16.4% |
| Interquartile 75% (IQ3) | 27.2% | 19.8% |
| Interquartile Range (IQR) | 10.8% | 3.4% |
| Standard Deviation (Sample) | 16.5% | 4.6% |
| Standard Deviation (Population) | 16.2% | 4.6% |
Demographics Similar to Eastern Europeans and Nonimmigrants by Unemployment Among Ages 16 to 19 years
In terms of unemployment among ages 16 to 19 years, the demographic groups most similar to Eastern Europeans are Iroquois (17.6%, a difference of 0.040%), Japanese (17.6%, a difference of 0.050%), Immigrants from Micronesia (17.6%, a difference of 0.090%), Immigrants from Nicaragua (17.6%, a difference of 0.10%), and Immigrants from Europe (17.6%, a difference of 0.12%). Similarly, the demographic groups most similar to Nonimmigrants are Immigrants from Eastern Europe (17.8%, a difference of 0.18%), Immigrants from Portugal (17.8%, a difference of 0.40%), Immigrants from Ethiopia (17.8%, a difference of 0.42%), Immigrants from Fiji (17.8%, a difference of 0.44%), and Immigrants from Ireland (17.8%, a difference of 0.48%).
| Demographics | Rating | Rank | Unemployment Among Ages 16 to 19 years |
| Eastern Europeans | 44.3 /100 | #184 | Average 17.6% |
| Iroquois | 43.4 /100 | #185 | Average 17.6% |
| Japanese | 43.2 /100 | #186 | Average 17.6% |
| Immigrants | Micronesia | 42.4 /100 | #187 | Average 17.6% |
| Immigrants | Nicaragua | 42.2 /100 | #188 | Average 17.6% |
| Immigrants | Europe | 41.8 /100 | #189 | Average 17.6% |
| Marshallese | 41.7 /100 | #190 | Average 17.6% |
| Immigrants | Costa Rica | 41.3 /100 | #191 | Average 17.6% |
| Immigrants | Philippines | 40.7 /100 | #192 | Average 17.7% |
| Immigrants | Australia | 40.6 /100 | #193 | Average 17.7% |
| Peruvians | 38.8 /100 | #194 | Fair 17.7% |
| Immigrants | Peru | 37.3 /100 | #195 | Fair 17.7% |
| Alaskan Athabascans | 34.1 /100 | #196 | Fair 17.7% |
| Immigrants | Czechoslovakia | 29.8 /100 | #197 | Fair 17.8% |
| Ethiopians | 29.6 /100 | #198 | Fair 17.8% |
| Immigrants | Ireland | 28.5 /100 | #199 | Fair 17.8% |
| Immigrants | Fiji | 27.7 /100 | #200 | Fair 17.8% |
| Immigrants | Ethiopia | 27.4 /100 | #201 | Fair 17.8% |
| Immigrants | Portugal | 27.2 /100 | #202 | Fair 17.8% |
| Immigrants | Eastern Europe | 23.6 /100 | #203 | Fair 17.8% |
| Immigrants | Nonimmigrants | 20.9 /100 | #204 | Fair 17.9% |