Dutch West Indian vs Swedish Unemployment Among Women with Children Under 6 years

COMPARE

Dutch West Indian
Race
Ancestry
AfghanAfricanAlaska NativeAlaskan AthabascanAlbanianAleutAlsatianAmericanApacheArabArapahoArgentineanArmenianAssyrian/Chaldean/SyriacAustralianAustrianBahamianBangladeshiBarbadianBasqueBelgianBelizeanBermudanBhutaneseBlackfeetBolivianBrazilianBritishBritish West IndianBulgarianBurmeseCajunCambodianCanadianCape VerdeanCarpatho RusynCelticCentral AmericanCentral American IndianCherokeeCheyenneChickasawChileanChineseChippewaChoctawColombianColvilleComancheCosta RicanCreeCreekCroatianCrowCubanCypriotCzechCzechoslovakianDanishDelawareDominicanDutchDutch West IndianEastern EuropeanEcuadorianEgyptianEnglishEstonianEthiopianEuropeanFijianFilipinoFinnishFrenchFrench American IndianFrench CanadianGermanGerman RussianGhanaianGreekGuamanian/ChamorroGuatemalanGuyaneseHaitianHmongHonduranHopiHoumaHungarianIcelanderIndian (Asian)IndonesianInupiatIranianIraqiIrishIroquoisIsraeliItalianJamaicanJapaneseJordanianKenyanKiowaKoreanLaotianLatvianLebaneseLiberianLithuanianLumbeeLuxembourgerMacedonianMalaysianMalteseMarshalleseMenomineeMexicanMexican American IndianMongolianMoroccanNative HawaiianNavajoNepaleseNew ZealanderNicaraguanNigerianNorthern EuropeanNorwegianOkinawanOsageOttawaPaiutePakistaniPalestinianPanamanianParaguayanPennsylvania GermanPeruvianPimaPolishPortuguesePotawatomiPuebloPuerto RicanPuget Sound SalishRomanianRussianSalvadoranSamoanScandinavianScotch-IrishScottishSeminoleSenegaleseSerbianShoshoneSierra LeoneanSiouxSlavicSlovakSloveneSomaliSouth AfricanSouth AmericanSouth American IndianSoviet UnionSpaniardSpanishSpanish AmericanSpanish American IndianSri LankanSubsaharan AfricanSudaneseSwissSyrianTaiwaneseThaiTlingit-HaidaTohono O'OdhamTonganTrinidadian and TobagonianTsimshianTurkishU.S. Virgin IslanderUgandanUkrainianUruguayanUteVenezuelanVietnameseWelshWest IndianYakamaYaquiYugoslavianYumanYup'ikZimbabwean
Immigration
NonimmigrantsImmigrantsAfghanistanAfricaAlbaniaArgentinaArmeniaAsiaAustraliaAustriaBahamasBangladeshBarbadosBelarusBelgiumBelizeBoliviaBosnia and HerzegovinaBrazilBulgariaBurma/MyanmarCabo VerdeCambodiaCameroonCanadaCaribbeanCentral AmericaChileChinaColombiaCongoCosta RicaCroatiaCubaCzechoslovakiaDenmarkDominicaDominican RepublicEastern AfricaEastern AsiaEastern EuropeEcuadorEgyptEl SalvadorEnglandEritreaEthiopiaEuropeFijiFranceGermanyGhanaGreeceGrenadaGuatemalaGuyanaHaitiHondurasHong KongHungaryIndiaIndonesiaIranIraqIrelandIsraelItalyJamaicaJapanJordanKazakhstanKenyaKoreaKuwaitLaosLatin AmericaLatviaLebanonLiberiaLithuaniaMalaysiaMexicoMicronesiaMiddle AfricaMoldovaMoroccoNepalNetherlandsNicaraguaNigeriaNorth AmericaNorth MacedoniaNorthern AfricaNorthern EuropeNorwayOceaniaPakistanPanamaPeruPhilippinesPolandPortugalRomaniaRussiaSaudi ArabiaScotlandSenegalSerbiaSierra LeoneSingaporeSomaliaSouth AfricaSouth AmericaSouth Central AsiaSouth Eastern AsiaSouthern EuropeSpainSri LankaSt. Vincent and the GrenadinesSudanSwedenSwitzerlandSyriaTaiwanThailandTrinidad and TobagoTurkeyUgandaUkraineUruguayUzbekistanVenezuelaVietnamWest IndiesWestern AfricaWestern AsiaWestern EuropeYemenZaireZimbabweAzores
Swedish
Race
Ancestry
AfghanAfricanAlaska NativeAlaskan AthabascanAlbanianAleutAlsatianAmericanApacheArabArapahoArgentineanArmenianAssyrian/Chaldean/SyriacAustralianAustrianBahamianBangladeshiBarbadianBasqueBelgianBelizeanBermudanBhutaneseBlackfeetBolivianBrazilianBritishBritish West IndianBulgarianBurmeseCajunCambodianCanadianCape VerdeanCarpatho RusynCelticCentral AmericanCentral American IndianCherokeeCheyenneChickasawChileanChineseChippewaChoctawColombianColvilleComancheCosta RicanCreeCreekCroatianCrowCubanCypriotCzechCzechoslovakianDanishDelawareDominicanDutchEastern EuropeanEcuadorianEgyptianEnglishEstonianEthiopianEuropeanFijianFilipinoFinnishFrenchFrench American IndianFrench CanadianGermanGerman RussianGhanaianGreekGuamanian/ChamorroGuatemalanGuyaneseHaitianHmongHonduranHopiHoumaHungarianIcelanderIndian (Asian)IndonesianInupiatIranianIraqiIrishIroquoisIsraeliItalianJamaicanJapaneseJordanianKenyanKiowaKoreanLaotianLatvianLebaneseLiberianLithuanianLumbeeLuxembourgerMacedonianMalaysianMalteseMarshalleseMenomineeMexicanMexican American IndianMongolianMoroccanNative HawaiianNavajoNepaleseNew ZealanderNicaraguanNigerianNorthern EuropeanNorwegianOkinawanOsageOttawaPaiutePakistaniPalestinianPanamanianParaguayanPennsylvania GermanPeruvianPimaPolishPortuguesePotawatomiPuebloPuerto RicanPuget Sound SalishRomanianRussianSalvadoranSamoanScandinavianScotch-IrishScottishSeminoleSenegaleseSerbianShoshoneSierra LeoneanSiouxSlavicSlovakSloveneSomaliSouth AfricanSouth AmericanSouth American IndianSoviet UnionSpaniardSpanishSpanish AmericanSpanish American IndianSri LankanSubsaharan AfricanSudaneseSwedishSwissSyrianTaiwaneseThaiTlingit-HaidaTohono O'OdhamTonganTrinidadian and TobagonianTsimshianTurkishU.S. Virgin IslanderUgandanUkrainianUruguayanUteVenezuelanVietnameseWelshWest IndianYakamaYaquiYugoslavianYumanYup'ikZimbabwean
Immigration
NonimmigrantsImmigrantsAfghanistanAfricaAlbaniaArgentinaArmeniaAsiaAustraliaAustriaBahamasBangladeshBarbadosBelarusBelgiumBelizeBoliviaBosnia and HerzegovinaBrazilBulgariaBurma/MyanmarCabo VerdeCambodiaCameroonCanadaCaribbeanCentral AmericaChileChinaColombiaCongoCosta RicaCroatiaCubaCzechoslovakiaDenmarkDominicaDominican RepublicEastern AfricaEastern AsiaEastern EuropeEcuadorEgyptEl SalvadorEnglandEritreaEthiopiaEuropeFijiFranceGermanyGhanaGreeceGrenadaGuatemalaGuyanaHaitiHondurasHong KongHungaryIndiaIndonesiaIranIraqIrelandIsraelItalyJamaicaJapanJordanKazakhstanKenyaKoreaKuwaitLaosLatin AmericaLatviaLebanonLiberiaLithuaniaMalaysiaMexicoMicronesiaMiddle AfricaMoldovaMoroccoNepalNetherlandsNicaraguaNigeriaNorth AmericaNorth MacedoniaNorthern AfricaNorthern EuropeNorwayOceaniaPakistanPanamaPeruPhilippinesPolandPortugalRomaniaRussiaSaudi ArabiaScotlandSenegalSerbiaSierra LeoneSingaporeSomaliaSouth AfricaSouth AmericaSouth Central AsiaSouth Eastern AsiaSouthern EuropeSpainSri LankaSt. Vincent and the GrenadinesSudanSwedenSwitzerlandSyriaTaiwanThailandTrinidad and TobagoTurkeyUgandaUkraineUruguayUzbekistanVenezuelaVietnamWest IndiesWestern AfricaWestern AsiaWestern EuropeYemenZaireZimbabweAzores
Unemployment Among Women with Children Under 6 years
Income
Poverty
Unemployment
Labor Participation
Family Structure
Vehicle Availability
Education Level
Disability

Unemployment Among Women with Children Under 6 years Comparison

Dutch West Indians

Swedes

Tragic
Excellent
9.5%
UNEMPLOYMENT AMONG WOMEN WITH CHILDREN UNDER 6 YEARS
0.0/ 100
METRIC RATING
317th/ 347
METRIC RANK
7.4%
UNEMPLOYMENT AMONG WOMEN WITH CHILDREN UNDER 6 YEARS
88.4/ 100
METRIC RATING
130th/ 347
METRIC RANK

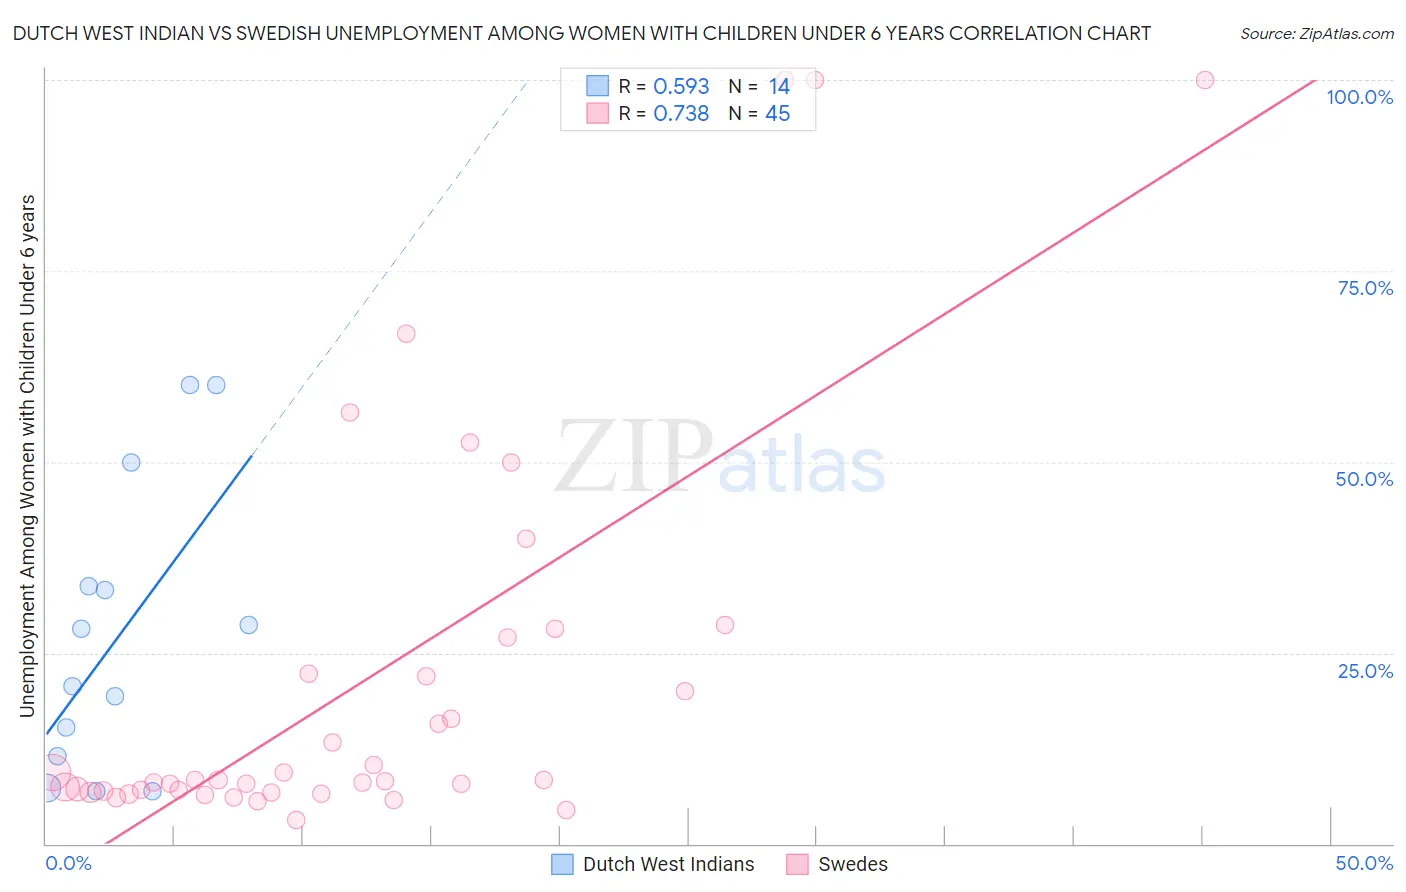
Dutch West Indian vs Swedish Unemployment Among Women with Children Under 6 years Correlation Chart

The statistical analysis conducted on geographies consisting of 76,130,897 people shows a substantial positive correlation between the proportion of Dutch West Indians and unemployment rate among women with children under the age of 6 in the United States with a correlation coefficient (R) of 0.593 and weighted average of 9.5%. Similarly, the statistical analysis conducted on geographies consisting of 362,245,772 people shows a strong positive correlation between the proportion of Swedes and unemployment rate among women with children under the age of 6 in the United States with a correlation coefficient (R) of 0.738 and weighted average of 7.4%, a difference of 28.2%.
Dutch West Indian vs Swedish Unemployment Among Women with Children Under 6 years

Unemployment Among Women with Children Under 6 years Correlation Summary

MeasurementDutch West IndianSwedish
Minimum6.9%3.1%
Maximum60.0%100.0%
Range53.1%96.9%
Mean27.2%21.3%
Median24.4%8.4%
Interquartile 25% (IQ1)11.5%6.8%
Interquartile 75% (IQ3)33.7%24.6%
Interquartile Range (IQR)22.2%17.8%
Standard Deviation (Sample)18.5%26.1%
Standard Deviation (Population)17.9%25.8%

Similar Demographics by Unemployment Among Women with Children Under 6 years

Demographics Similar to Dutch West Indians by Unemployment Among Women with Children Under 6 years

In terms of unemployment among women with children under 6 years, the demographic groups most similar to Dutch West Indians are Osage (9.5%, a difference of 0.060%), Houma (9.4%, a difference of 0.79%), Marshallese (9.6%, a difference of 1.1%), Potawatomi (9.6%, a difference of 1.1%), and Central American Indian (9.6%, a difference of 1.2%).
DemographicsRating | RankUnemployment Among Women with Children Under 6 years
Cajuns
0.0
/100
|
#310
Tragic
9.2%
French American Indians
0.0
/100
|
#311
Tragic
9.2%
Immigrants | Azores
0.0
/100
|
#312
Tragic
9.2%
Americans
0.0
/100
|
#313
Tragic
9.3%
Fijians
0.0
/100
|
#314
Tragic
9.3%
Cherokee
0.0
/100
|
#315
Tragic
9.3%
Houma
0.0
/100
|
#316
Tragic
9.4%
Dutch West Indians
0.0
/100
|
#317
Tragic
9.5%
Osage
0.0
/100
|
#318
Tragic
9.5%
Marshallese
0.0
/100
|
#319
Tragic
9.6%
Potawatomi
0.0
/100
|
#320
Tragic
9.6%
Central American Indians
0.0
/100
|
#321
Tragic
9.6%
Alaska Natives
0.0
/100
|
#322
Tragic
9.6%
Immigrants | Bahamas
0.0
/100
|
#323
Tragic
9.6%
Paiute
0.0
/100
|
#324
Tragic
9.7%

Demographics Similar to Swedes by Unemployment Among Women with Children Under 6 years

In terms of unemployment among women with children under 6 years, the demographic groups most similar to Swedes are Ukrainian (7.4%, a difference of 0.040%), Slovene (7.4%, a difference of 0.14%), Immigrants from Armenia (7.4%, a difference of 0.17%), Immigrants from Uganda (7.4%, a difference of 0.29%), and Immigrants from Bolivia (7.4%, a difference of 0.40%).
DemographicsRating | RankUnemployment Among Women with Children Under 6 years
Immigrants | Zaire
93.3
/100
|
#123
Exceptional
7.3%
Immigrants | South Africa
92.5
/100
|
#124
Exceptional
7.3%
Pakistanis
92.2
/100
|
#125
Exceptional
7.3%
Immigrants | Burma/Myanmar
91.9
/100
|
#126
Exceptional
7.3%
Jordanians
91.5
/100
|
#127
Exceptional
7.3%
Zimbabweans
91.5
/100
|
#128
Exceptional
7.3%
Slovenes
89.2
/100
|
#129
Excellent
7.4%
Swedes
88.4
/100
|
#130
Excellent
7.4%
Ukrainians
88.2
/100
|
#131
Excellent
7.4%
Immigrants | Armenia
87.4
/100
|
#132
Excellent
7.4%
Immigrants | Uganda
86.5
/100
|
#133
Excellent
7.4%
Immigrants | Bolivia
85.7
/100
|
#134
Excellent
7.4%
Immigrants | Northern Africa
85.3
/100
|
#135
Excellent
7.4%
Immigrants | Morocco
84.9
/100
|
#136
Excellent
7.4%
Immigrants | Cambodia
84.6
/100
|
#137
Excellent
7.4%