Dutch West Indian vs Kenyan Unemployment Among Ages 45 to 54 years
COMPARE
Dutch West Indian
Kenyan
Unemployment Among Ages 45 to 54 years
Unemployment Among Ages 45 to 54 years Comparison
Dutch West Indians
Kenyans
5.0%
UNEMPLOYMENT AMONG AGES 45 TO 54 YEARS
0.0/ 100
METRIC RATING
278th/ 347
METRIC RANK
4.3%
UNEMPLOYMENT AMONG AGES 45 TO 54 YEARS
98.1/ 100
METRIC RATING
75th/ 347
METRIC RANK
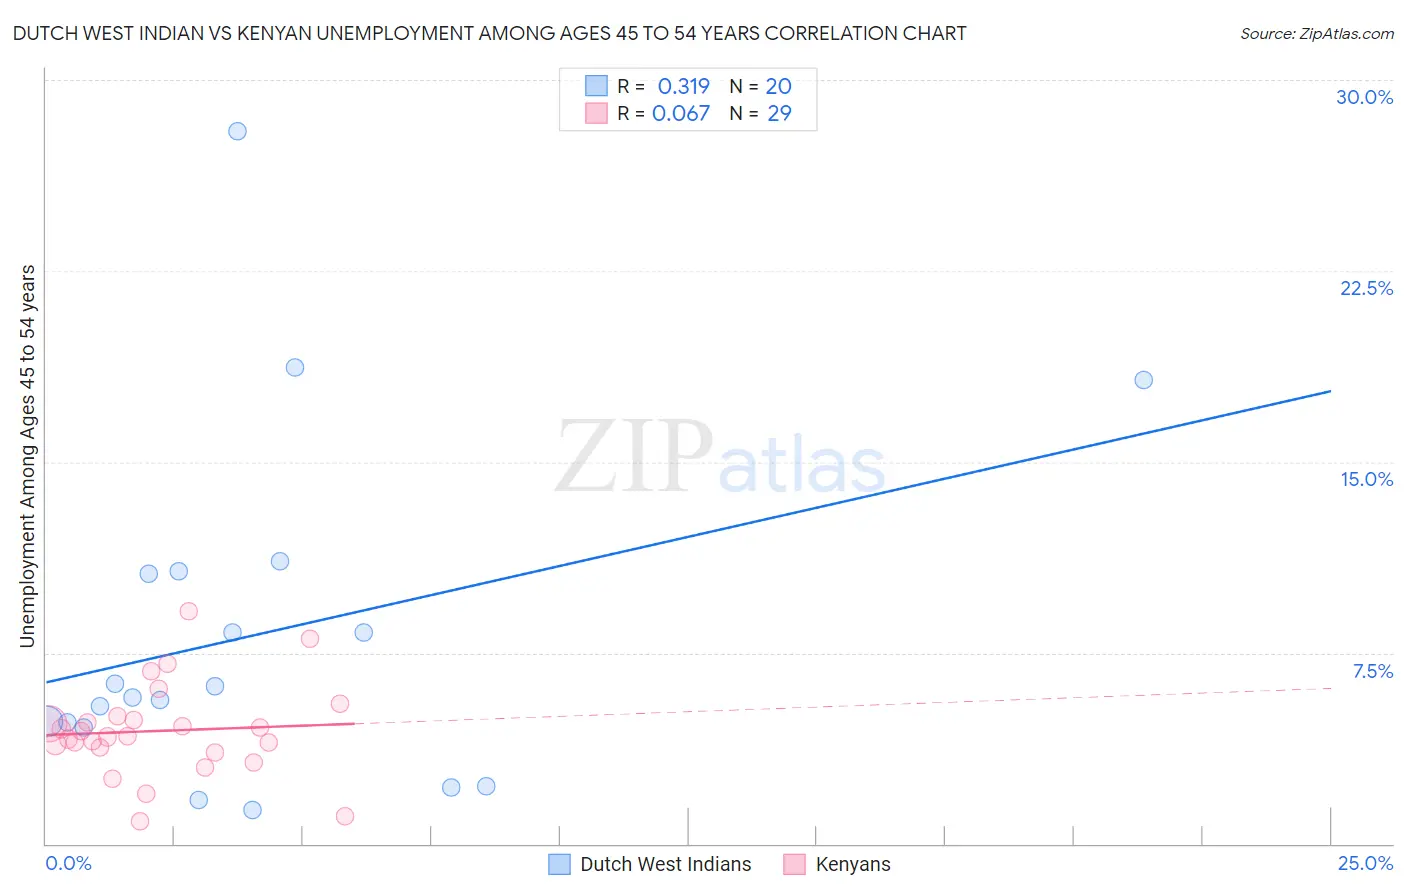
Dutch West Indian vs Kenyan Unemployment Among Ages 45 to 54 years Correlation Chart
The statistical analysis conducted on geographies consisting of 84,454,411 people shows a mild positive correlation between the proportion of Dutch West Indians and unemployment rate among population between the ages 45 and 54 in the United States with a correlation coefficient (R) of 0.319 and weighted average of 5.0%. Similarly, the statistical analysis conducted on geographies consisting of 166,610,701 people shows a slight positive correlation between the proportion of Kenyans and unemployment rate among population between the ages 45 and 54 in the United States with a correlation coefficient (R) of 0.067 and weighted average of 4.3%, a difference of 16.8%.
Unemployment Among Ages 45 to 54 years Correlation Summary
| Measurement | Dutch West Indian | Kenyan |
| Minimum | 1.3% | 0.86% |
| Maximum | 28.0% | 9.1% |
| Range | 26.7% | 8.3% |
| Mean | 8.2% | 4.4% |
| Median | 5.9% | 4.2% |
| Interquartile 25% (IQ1) | 4.7% | 3.7% |
| Interquartile 75% (IQ3) | 10.7% | 4.9% |
| Interquartile Range (IQR) | 6.0% | 1.3% |
| Standard Deviation (Sample) | 6.7% | 1.8% |
| Standard Deviation (Population) | 6.5% | 1.8% |
Similar Demographics by Unemployment Among Ages 45 to 54 years
Demographics Similar to Dutch West Indians by Unemployment Among Ages 45 to 54 years
In terms of unemployment among ages 45 to 54 years, the demographic groups most similar to Dutch West Indians are Nepalese (5.0%, a difference of 0.14%), Immigrants from Mexico (5.0%, a difference of 0.21%), French American Indian (5.0%, a difference of 0.33%), Blackfeet (5.1%, a difference of 0.35%), and Spanish American Indian (5.1%, a difference of 0.42%).
| Demographics | Rating | Rank | Unemployment Among Ages 45 to 54 years |
| Cajuns | 0.0 /100 | #271 | Tragic 5.0% |
| Immigrants | Central America | 0.0 /100 | #272 | Tragic 5.0% |
| Immigrants | Latin America | 0.0 /100 | #273 | Tragic 5.0% |
| U.S. Virgin Islanders | 0.0 /100 | #274 | Tragic 5.0% |
| Bermudans | 0.0 /100 | #275 | Tragic 5.0% |
| French American Indians | 0.0 /100 | #276 | Tragic 5.0% |
| Immigrants | Mexico | 0.0 /100 | #277 | Tragic 5.0% |
| Dutch West Indians | 0.0 /100 | #278 | Tragic 5.0% |
| Nepalese | 0.0 /100 | #279 | Tragic 5.0% |
| Blackfeet | 0.0 /100 | #280 | Tragic 5.1% |
| Spanish American Indians | 0.0 /100 | #281 | Tragic 5.1% |
| Africans | 0.0 /100 | #282 | Tragic 5.1% |
| Hispanics or Latinos | 0.0 /100 | #283 | Tragic 5.1% |
| Kiowa | 0.0 /100 | #284 | Tragic 5.1% |
| Iroquois | 0.0 /100 | #285 | Tragic 5.1% |
Demographics Similar to Kenyans by Unemployment Among Ages 45 to 54 years
In terms of unemployment among ages 45 to 54 years, the demographic groups most similar to Kenyans are Slavic (4.3%, a difference of 0.010%), Immigrants from Belgium (4.3%, a difference of 0.030%), Canadian (4.3%, a difference of 0.040%), Chilean (4.3%, a difference of 0.060%), and German Russian (4.3%, a difference of 0.15%).
| Demographics | Rating | Rank | Unemployment Among Ages 45 to 54 years |
| Slovaks | 98.8 /100 | #68 | Exceptional 4.3% |
| Immigrants | Japan | 98.7 /100 | #69 | Exceptional 4.3% |
| Paraguayans | 98.6 /100 | #70 | Exceptional 4.3% |
| Palestinians | 98.5 /100 | #71 | Exceptional 4.3% |
| Whites/Caucasians | 98.4 /100 | #72 | Exceptional 4.3% |
| Canadians | 98.2 /100 | #73 | Exceptional 4.3% |
| Immigrants | Belgium | 98.2 /100 | #74 | Exceptional 4.3% |
| Kenyans | 98.1 /100 | #75 | Exceptional 4.3% |
| Slavs | 98.1 /100 | #76 | Exceptional 4.3% |
| Chileans | 98.1 /100 | #77 | Exceptional 4.3% |
| German Russians | 97.9 /100 | #78 | Exceptional 4.3% |
| Serbians | 97.9 /100 | #79 | Exceptional 4.3% |
| Cambodians | 97.8 /100 | #80 | Exceptional 4.3% |
| Immigrants | Micronesia | 97.6 /100 | #81 | Exceptional 4.3% |
| Eastern Europeans | 97.6 /100 | #82 | Exceptional 4.3% |