Dutch West Indian vs Immigrants from Yemen Unemployment Among Women with Children Under 18 years

COMPARE

Dutch West Indian
Race
Ancestry
AfghanAfricanAlaska NativeAlaskan AthabascanAlbanianAleutAlsatianAmericanApacheArabArapahoArgentineanArmenianAssyrian/Chaldean/SyriacAustralianAustrianBahamianBangladeshiBarbadianBasqueBelgianBelizeanBermudanBhutaneseBlackfeetBolivianBrazilianBritishBritish West IndianBulgarianBurmeseCajunCambodianCanadianCape VerdeanCarpatho RusynCelticCentral AmericanCentral American IndianCherokeeCheyenneChickasawChileanChineseChippewaChoctawColombianColvilleComancheCosta RicanCreeCreekCroatianCrowCubanCypriotCzechCzechoslovakianDanishDelawareDominicanDutchDutch West IndianEastern EuropeanEcuadorianEgyptianEnglishEstonianEthiopianEuropeanFijianFilipinoFinnishFrenchFrench American IndianFrench CanadianGermanGerman RussianGhanaianGreekGuamanian/ChamorroGuatemalanGuyaneseHaitianHmongHonduranHopiHoumaHungarianIcelanderIndian (Asian)IndonesianInupiatIranianIraqiIrishIroquoisIsraeliItalianJamaicanJapaneseJordanianKenyanKiowaKoreanLaotianLatvianLebaneseLiberianLithuanianLumbeeLuxembourgerMacedonianMalaysianMalteseMarshalleseMenomineeMexicanMexican American IndianMongolianMoroccanNative HawaiianNavajoNepaleseNew ZealanderNicaraguanNigerianNorthern EuropeanNorwegianOkinawanOsageOttawaPaiutePakistaniPalestinianPanamanianParaguayanPennsylvania GermanPeruvianPimaPolishPortuguesePotawatomiPuebloPuerto RicanPuget Sound SalishRomanianRussianSalvadoranSamoanScandinavianScotch-IrishScottishSeminoleSenegaleseSerbianShoshoneSierra LeoneanSiouxSlavicSlovakSloveneSomaliSouth AfricanSouth AmericanSouth American IndianSoviet UnionSpaniardSpanishSpanish AmericanSpanish American IndianSri LankanSubsaharan AfricanSudaneseSwedishSwissSyrianTaiwaneseThaiTlingit-HaidaTohono O'OdhamTonganTrinidadian and TobagonianTsimshianTurkishU.S. Virgin IslanderUgandanUkrainianUruguayanUteVenezuelanVietnameseWelshWest IndianYakamaYaquiYugoslavianYumanYup'ikZimbabwean
Immigration
NonimmigrantsImmigrantsAfghanistanAfricaAlbaniaArgentinaArmeniaAsiaAustraliaAustriaBahamasBangladeshBarbadosBelarusBelgiumBelizeBoliviaBosnia and HerzegovinaBrazilBulgariaBurma/MyanmarCabo VerdeCambodiaCameroonCanadaCaribbeanCentral AmericaChileChinaColombiaCongoCosta RicaCroatiaCubaCzechoslovakiaDenmarkDominicaDominican RepublicEastern AfricaEastern AsiaEastern EuropeEcuadorEgyptEl SalvadorEnglandEritreaEthiopiaEuropeFijiFranceGermanyGhanaGreeceGrenadaGuatemalaGuyanaHaitiHondurasHong KongHungaryIndiaIndonesiaIranIraqIrelandIsraelItalyJamaicaJapanJordanKazakhstanKenyaKoreaKuwaitLaosLatin AmericaLatviaLebanonLiberiaLithuaniaMalaysiaMexicoMicronesiaMiddle AfricaMoldovaMoroccoNepalNetherlandsNicaraguaNigeriaNorth AmericaNorth MacedoniaNorthern AfricaNorthern EuropeNorwayOceaniaPakistanPanamaPeruPhilippinesPolandPortugalRomaniaRussiaSaudi ArabiaScotlandSenegalSerbiaSierra LeoneSingaporeSomaliaSouth AfricaSouth AmericaSouth Central AsiaSouth Eastern AsiaSouthern EuropeSpainSri LankaSt. Vincent and the GrenadinesSudanSwedenSwitzerlandSyriaTaiwanThailandTrinidad and TobagoTurkeyUgandaUkraineUruguayUzbekistanVenezuelaVietnamWest IndiesWestern AfricaWestern AsiaWestern EuropeZaireZimbabweAzores
Immigrants from Yemen
Race
Ancestry
AfghanAfricanAlaska NativeAlaskan AthabascanAlbanianAleutAlsatianAmericanApacheArabArapahoArgentineanArmenianAssyrian/Chaldean/SyriacAustralianAustrianBahamianBangladeshiBarbadianBasqueBelgianBelizeanBermudanBhutaneseBlackfeetBolivianBrazilianBritishBritish West IndianBulgarianBurmeseCajunCambodianCanadianCape VerdeanCarpatho RusynCelticCentral AmericanCentral American IndianCherokeeCheyenneChickasawChileanChineseChippewaChoctawColombianColvilleComancheCosta RicanCreeCreekCroatianCrowCubanCypriotCzechCzechoslovakianDanishDelawareDominicanDutchEastern EuropeanEcuadorianEgyptianEnglishEstonianEthiopianEuropeanFijianFilipinoFinnishFrenchFrench American IndianFrench CanadianGermanGerman RussianGhanaianGreekGuamanian/ChamorroGuatemalanGuyaneseHaitianHmongHonduranHopiHoumaHungarianIcelanderIndian (Asian)IndonesianInupiatIranianIraqiIrishIroquoisIsraeliItalianJamaicanJapaneseJordanianKenyanKiowaKoreanLaotianLatvianLebaneseLiberianLithuanianLumbeeLuxembourgerMacedonianMalaysianMalteseMarshalleseMenomineeMexicanMexican American IndianMongolianMoroccanNative HawaiianNavajoNepaleseNew ZealanderNicaraguanNigerianNorthern EuropeanNorwegianOkinawanOsageOttawaPaiutePakistaniPalestinianPanamanianParaguayanPennsylvania GermanPeruvianPimaPolishPortuguesePotawatomiPuebloPuerto RicanPuget Sound SalishRomanianRussianSalvadoranSamoanScandinavianScotch-IrishScottishSeminoleSenegaleseSerbianShoshoneSierra LeoneanSiouxSlavicSlovakSloveneSomaliSouth AfricanSouth AmericanSouth American IndianSoviet UnionSpaniardSpanishSpanish AmericanSpanish American IndianSri LankanSubsaharan AfricanSudaneseSwedishSwissSyrianTaiwaneseThaiTlingit-HaidaTohono O'OdhamTonganTrinidadian and TobagonianTsimshianTurkishU.S. Virgin IslanderUgandanUkrainianUruguayanUteVenezuelanVietnameseWelshWest IndianYakamaYaquiYugoslavianYumanYup'ikZimbabwean
Immigration
NonimmigrantsImmigrantsAfghanistanAfricaAlbaniaArgentinaArmeniaAsiaAustraliaAustriaBahamasBangladeshBarbadosBelarusBelgiumBelizeBoliviaBosnia and HerzegovinaBrazilBulgariaBurma/MyanmarCabo VerdeCambodiaCameroonCanadaCaribbeanCentral AmericaChileChinaColombiaCongoCosta RicaCroatiaCubaCzechoslovakiaDenmarkDominicaDominican RepublicEastern AfricaEastern AsiaEastern EuropeEcuadorEgyptEl SalvadorEnglandEritreaEthiopiaEuropeFijiFranceGermanyGhanaGreeceGrenadaGuatemalaGuyanaHaitiHondurasHong KongHungaryIndiaIndonesiaIranIraqIrelandIsraelItalyJamaicaJapanJordanKazakhstanKenyaKoreaKuwaitLaosLatin AmericaLatviaLebanonLiberiaLithuaniaMalaysiaMexicoMicronesiaMiddle AfricaMoldovaMoroccoNepalNetherlandsNicaraguaNigeriaNorth AmericaNorth MacedoniaNorthern AfricaNorthern EuropeNorwayOceaniaPakistanPanamaPeruPhilippinesPolandPortugalRomaniaRussiaSaudi ArabiaScotlandSenegalSerbiaSierra LeoneSingaporeSomaliaSouth AfricaSouth AmericaSouth Central AsiaSouth Eastern AsiaSouthern EuropeSpainSri LankaSt. Vincent and the GrenadinesSudanSwedenSwitzerlandSyriaTaiwanThailandTrinidad and TobagoTurkeyUgandaUkraineUruguayUzbekistanVenezuelaVietnamWest IndiesWestern AfricaWestern AsiaWestern EuropeYemenZaireZimbabweAzores
Unemployment Among Women with Children Under 18 years
Income
Poverty
Unemployment
Labor Participation
Family Structure
Vehicle Availability
Education Level
Disability

Unemployment Among Women with Children Under 18 years Comparison

Dutch West Indians

Immigrants from Yemen

Tragic
Tragic
6.2%
UNEMPLOYMENT AMONG WOMEN WITH CHILDREN UNDER 18 YEARS
0.0/ 100
METRIC RATING
275th/ 347
METRIC RANK
8.2%
UNEMPLOYMENT AMONG WOMEN WITH CHILDREN UNDER 18 YEARS
0.0/ 100
METRIC RATING
338th/ 347
METRIC RANK

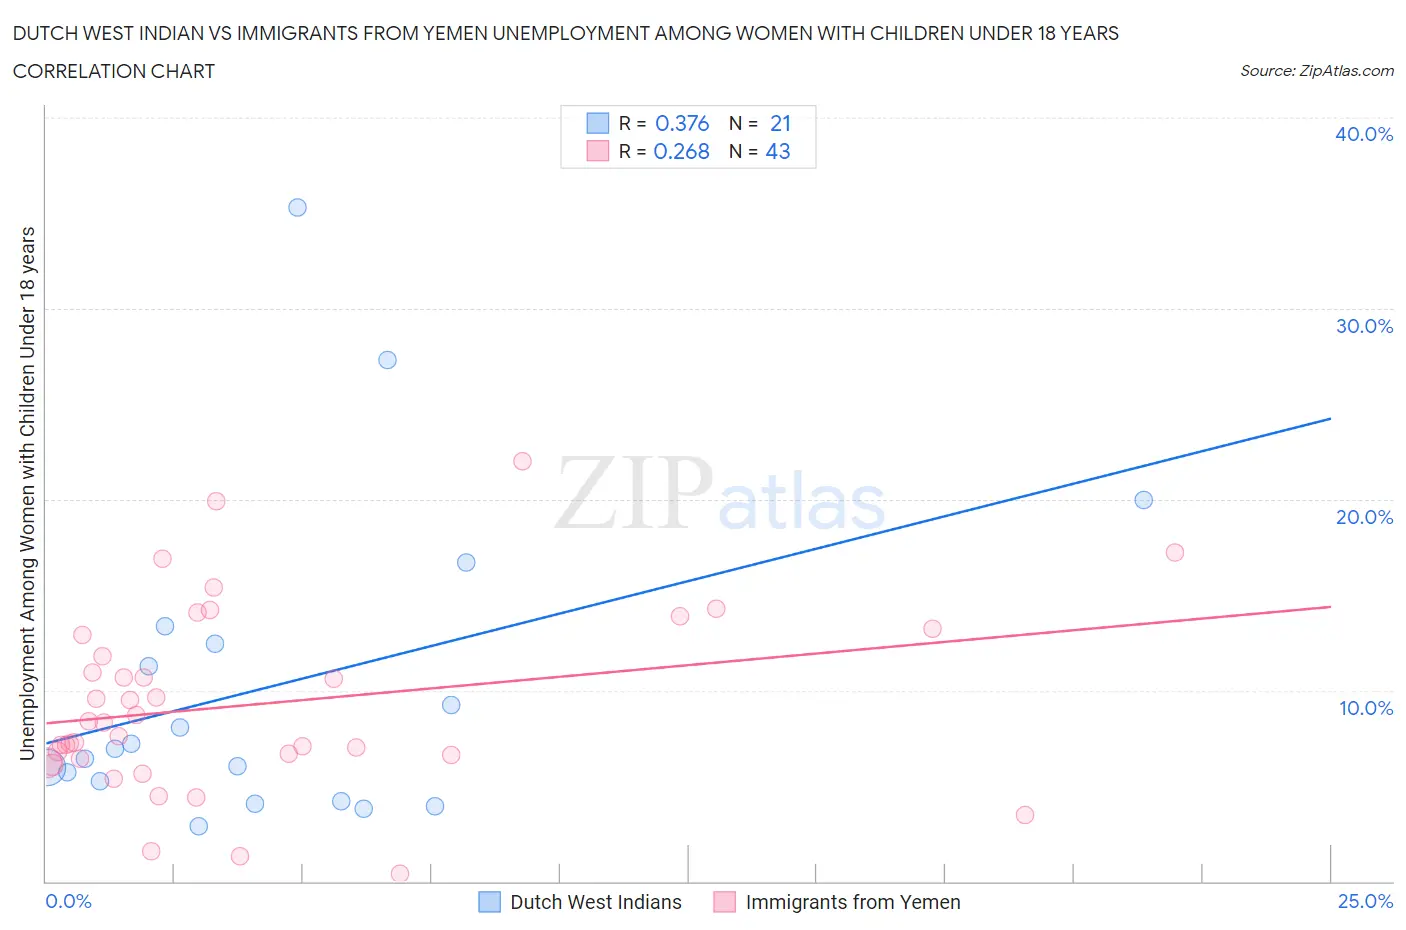
Dutch West Indian vs Immigrants from Yemen Unemployment Among Women with Children Under 18 years Correlation Chart

The statistical analysis conducted on geographies consisting of 84,109,270 people shows a mild positive correlation between the proportion of Dutch West Indians and unemployment rate among women with children under the age of 18 in the United States with a correlation coefficient (R) of 0.376 and weighted average of 6.2%. Similarly, the statistical analysis conducted on geographies consisting of 82,082,671 people shows a weak positive correlation between the proportion of Immigrants from Yemen and unemployment rate among women with children under the age of 18 in the United States with a correlation coefficient (R) of 0.268 and weighted average of 8.2%, a difference of 31.5%.
Dutch West Indian vs Immigrants from Yemen Unemployment Among Women with Children Under 18 years

Unemployment Among Women with Children Under 18 years Correlation Summary

MeasurementDutch West IndianImmigrants from Yemen
Minimum2.9%0.40%
Maximum35.3%22.0%
Range32.4%21.6%
Mean10.3%9.3%
Median6.9%8.3%
Interquartile 25% (IQ1)4.7%6.4%
Interquartile 75% (IQ3)12.9%12.9%
Interquartile Range (IQR)8.1%6.5%
Standard Deviation (Sample)8.4%4.8%
Standard Deviation (Population)8.2%4.7%

Similar Demographics by Unemployment Among Women with Children Under 18 years

Demographics Similar to Dutch West Indians by Unemployment Among Women with Children Under 18 years

In terms of unemployment among women with children under 18 years, the demographic groups most similar to Dutch West Indians are Immigrants from Ghana (6.2%, a difference of 0.11%), Mexican American Indian (6.2%, a difference of 0.12%), Immigrants from Barbados (6.2%, a difference of 0.13%), Senegalese (6.2%, a difference of 0.18%), and Immigrants from Western Africa (6.2%, a difference of 0.19%).
DemographicsRating | RankUnemployment Among Women with Children Under 18 years
Trinidadians and Tobagonians
0.1
/100
|
#268
Tragic
6.2%
Cajuns
0.1
/100
|
#269
Tragic
6.2%
Ghanaians
0.1
/100
|
#270
Tragic
6.2%
Central Americans
0.0
/100
|
#271
Tragic
6.2%
Salvadorans
0.0
/100
|
#272
Tragic
6.2%
Immigrants | Western Africa
0.0
/100
|
#273
Tragic
6.2%
Senegalese
0.0
/100
|
#274
Tragic
6.2%
Dutch West Indians
0.0
/100
|
#275
Tragic
6.2%
Immigrants | Ghana
0.0
/100
|
#276
Tragic
6.2%
Mexican American Indians
0.0
/100
|
#277
Tragic
6.2%
Immigrants | Barbados
0.0
/100
|
#278
Tragic
6.2%
Immigrants | Portugal
0.0
/100
|
#279
Tragic
6.3%
Guatemalans
0.0
/100
|
#280
Tragic
6.3%
Immigrants | El Salvador
0.0
/100
|
#281
Tragic
6.3%
Immigrants | St. Vincent and the Grenadines
0.0
/100
|
#282
Tragic
6.3%

Demographics Similar to Immigrants from Yemen by Unemployment Among Women with Children Under 18 years

In terms of unemployment among women with children under 18 years, the demographic groups most similar to Immigrants from Yemen are Navajo (8.2%, a difference of 0.52%), Crow (8.2%, a difference of 0.72%), Yakama (8.1%, a difference of 1.6%), Sioux (7.9%, a difference of 3.1%), and Apache (7.9%, a difference of 3.4%).
DemographicsRating | RankUnemployment Among Women with Children Under 18 years
Hopi
0.0
/100
|
#331
Tragic
7.4%
Dominicans
0.0
/100
|
#332
Tragic
7.5%
Immigrants | Dominican Republic
0.0
/100
|
#333
Tragic
7.5%
Cheyenne
0.0
/100
|
#334
Tragic
7.8%
Apache
0.0
/100
|
#335
Tragic
7.9%
Sioux
0.0
/100
|
#336
Tragic
7.9%
Yakama
0.0
/100
|
#337
Tragic
8.1%
Immigrants | Yemen
0.0
/100
|
#338
Tragic
8.2%
Navajo
0.0
/100
|
#339
Tragic
8.2%
Crow
0.0
/100
|
#340
Tragic
8.2%
Tohono O'odham
0.0
/100
|
#341
Tragic
8.9%
Puerto Ricans
0.0
/100
|
#342
Tragic
9.0%
Arapaho
0.0
/100
|
#343
Tragic
9.2%
Inupiat
0.0
/100
|
#344
Tragic
9.6%
Yuman
0.0
/100
|
#345
Tragic
9.8%