Dutch West Indian vs Immigrants from West Indies Unemployment Among Youth under 25 years
COMPARE
Dutch West Indian
Immigrants from West Indies
Unemployment Among Youth under 25 years
Unemployment Among Youth under 25 years Comparison
Dutch West Indians
Immigrants from West Indies
12.1%
UNEMPLOYMENT AMONG YOUTH UNDER 25 YEARS
1.1/ 100
METRIC RATING
240th/ 347
METRIC RANK
14.2%
UNEMPLOYMENT AMONG YOUTH UNDER 25 YEARS
0.0/ 100
METRIC RATING
310th/ 347
METRIC RANK
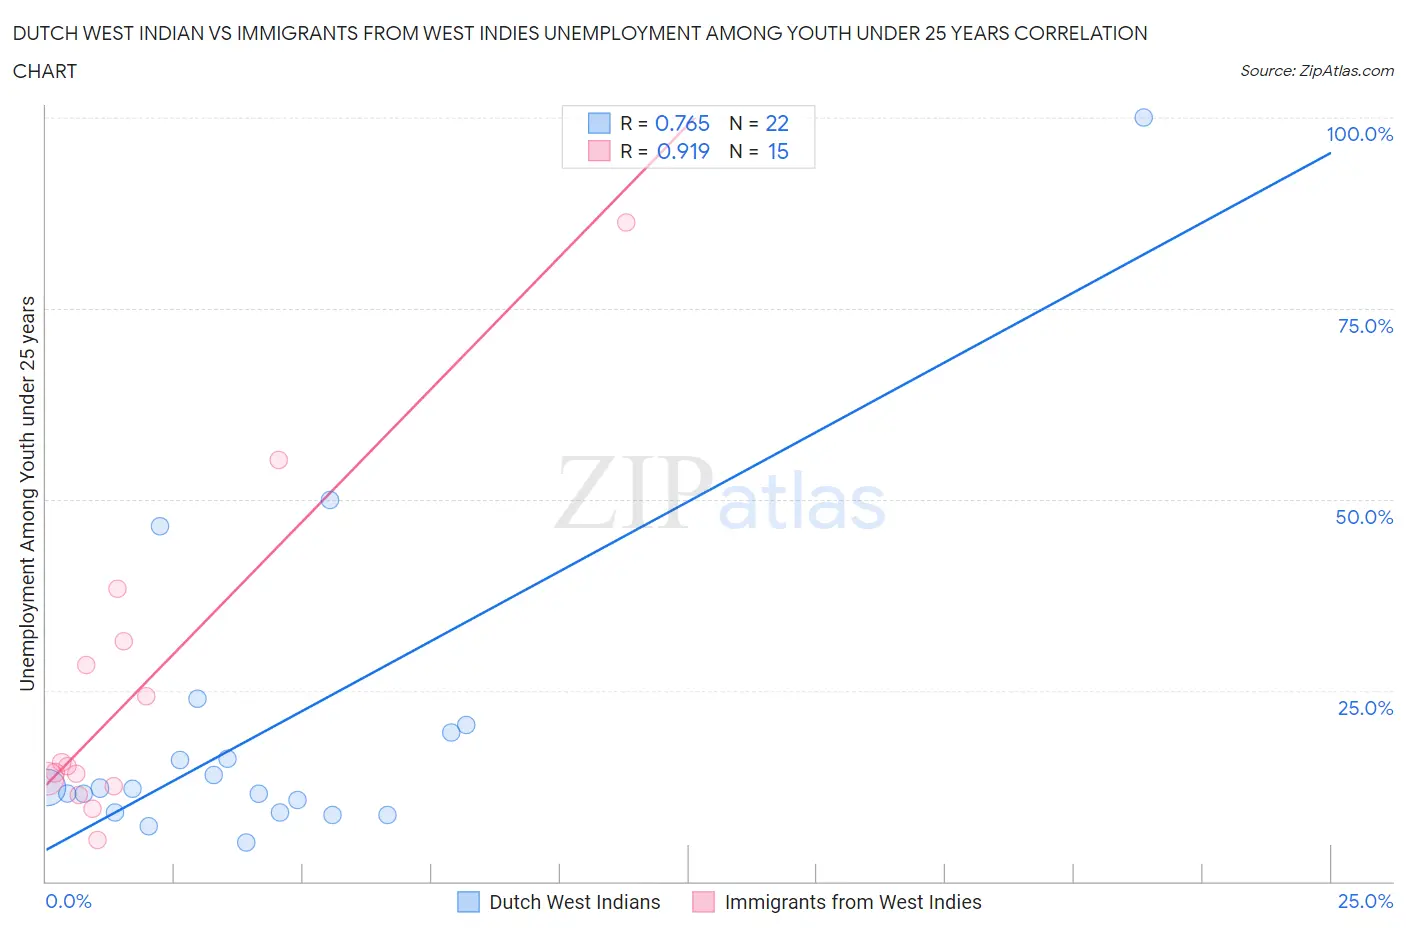
Dutch West Indian vs Immigrants from West Indies Unemployment Among Youth under 25 years Correlation Chart
The statistical analysis conducted on geographies consisting of 85,012,533 people shows a strong positive correlation between the proportion of Dutch West Indians and unemployment rate among youth under the age of 25 in the United States with a correlation coefficient (R) of 0.765 and weighted average of 12.1%. Similarly, the statistical analysis conducted on geographies consisting of 72,363,085 people shows a near-perfect positive correlation between the proportion of Immigrants from West Indies and unemployment rate among youth under the age of 25 in the United States with a correlation coefficient (R) of 0.919 and weighted average of 14.2%, a difference of 17.0%.
Unemployment Among Youth under 25 years Correlation Summary
| Measurement | Dutch West Indian | Immigrants from West Indies |
| Minimum | 5.1% | 5.4% |
| Maximum | 100.0% | 86.2% |
| Range | 94.9% | 80.8% |
| Mean | 19.8% | 25.0% |
| Median | 12.1% | 15.0% |
| Interquartile 25% (IQ1) | 9.1% | 12.4% |
| Interquartile 75% (IQ3) | 19.5% | 31.5% |
| Interquartile Range (IQR) | 10.4% | 19.1% |
| Standard Deviation (Sample) | 21.2% | 21.4% |
| Standard Deviation (Population) | 20.7% | 20.7% |
Similar Demographics by Unemployment Among Youth under 25 years
Demographics Similar to Dutch West Indians by Unemployment Among Youth under 25 years
In terms of unemployment among youth under 25 years, the demographic groups most similar to Dutch West Indians are Immigrants from Albania (12.1%, a difference of 0.020%), Immigrants from Africa (12.1%, a difference of 0.030%), Albanian (12.1%, a difference of 0.080%), Native Hawaiian (12.1%, a difference of 0.15%), and Immigrants (12.1%, a difference of 0.17%).
| Demographics | Rating | Rank | Unemployment Among Youth under 25 years |
| South American Indians | 1.6 /100 | #233 | Tragic 12.1% |
| Guatemalans | 1.4 /100 | #234 | Tragic 12.1% |
| Immigrants | Guatemala | 1.4 /100 | #235 | Tragic 12.1% |
| Immigrants | Immigrants | 1.3 /100 | #236 | Tragic 12.1% |
| Native Hawaiians | 1.3 /100 | #237 | Tragic 12.1% |
| Albanians | 1.2 /100 | #238 | Tragic 12.1% |
| Immigrants | Africa | 1.1 /100 | #239 | Tragic 12.1% |
| Dutch West Indians | 1.1 /100 | #240 | Tragic 12.1% |
| Immigrants | Albania | 1.1 /100 | #241 | Tragic 12.1% |
| Immigrants | Western Asia | 0.8 /100 | #242 | Tragic 12.2% |
| Immigrants | Azores | 0.6 /100 | #243 | Tragic 12.2% |
| Alaskan Athabascans | 0.6 /100 | #244 | Tragic 12.2% |
| Spanish Americans | 0.6 /100 | #245 | Tragic 12.2% |
| Immigrants | Honduras | 0.6 /100 | #246 | Tragic 12.2% |
| Immigrants | Greece | 0.6 /100 | #247 | Tragic 12.2% |
Demographics Similar to Immigrants from West Indies by Unemployment Among Youth under 25 years
In terms of unemployment among youth under 25 years, the demographic groups most similar to Immigrants from West Indies are Immigrants from Bangladesh (14.2%, a difference of 0.030%), Vietnamese (14.3%, a difference of 0.34%), Aleut (14.1%, a difference of 0.54%), Immigrants from Armenia (14.4%, a difference of 1.2%), and Jamaican (14.4%, a difference of 1.3%).
| Demographics | Rating | Rank | Unemployment Among Youth under 25 years |
| Belizeans | 0.0 /100 | #303 | Tragic 13.8% |
| Houma | 0.0 /100 | #304 | Tragic 13.8% |
| Haitians | 0.0 /100 | #305 | Tragic 13.9% |
| Pueblo | 0.0 /100 | #306 | Tragic 13.9% |
| Immigrants | Haiti | 0.0 /100 | #307 | Tragic 14.0% |
| Immigrants | Belize | 0.0 /100 | #308 | Tragic 14.0% |
| Aleuts | 0.0 /100 | #309 | Tragic 14.1% |
| Immigrants | West Indies | 0.0 /100 | #310 | Tragic 14.2% |
| Immigrants | Bangladesh | 0.0 /100 | #311 | Tragic 14.2% |
| Vietnamese | 0.0 /100 | #312 | Tragic 14.3% |
| Immigrants | Armenia | 0.0 /100 | #313 | Tragic 14.4% |
| Jamaicans | 0.0 /100 | #314 | Tragic 14.4% |
| Sioux | 0.0 /100 | #315 | Tragic 14.4% |
| Natives/Alaskans | 0.0 /100 | #316 | Tragic 14.5% |
| Blacks/African Americans | 0.0 /100 | #317 | Tragic 14.5% |