Dutch vs Scandinavian Female Unemployment
COMPARE
Dutch
Scandinavian
Female Unemployment
Female Unemployment Comparison
Dutch
Scandinavians
4.6%
FEMALE UNEMPLOYMENT
100.0/ 100
METRIC RATING
12th/ 347
METRIC RANK
4.6%
FEMALE UNEMPLOYMENT
100.0/ 100
METRIC RATING
11th/ 347
METRIC RANK
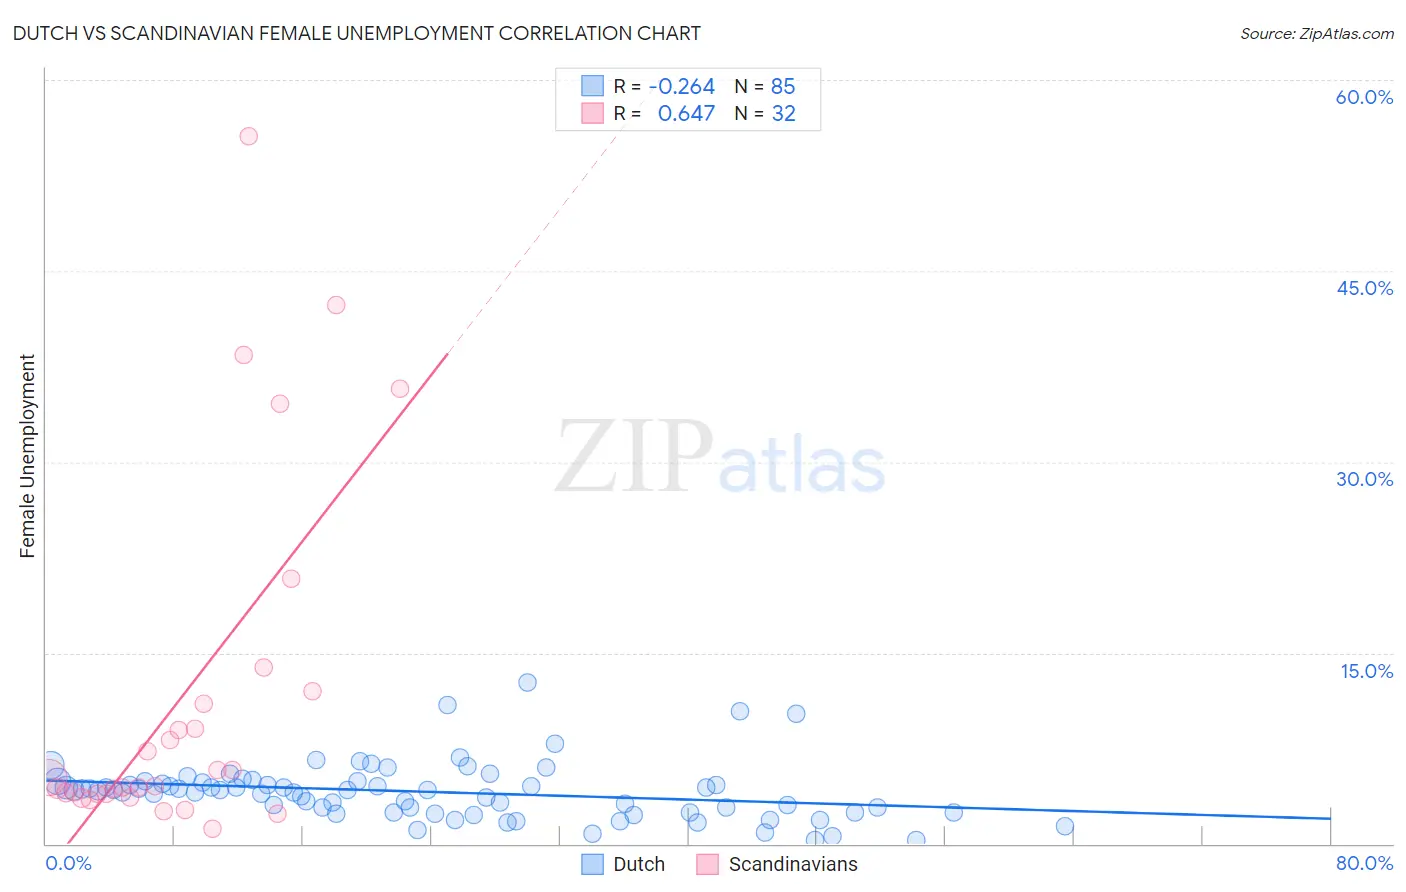
Dutch vs Scandinavian Female Unemployment Correlation Chart
The statistical analysis conducted on geographies consisting of 542,310,807 people shows a weak negative correlation between the proportion of Dutch and unemploymnet rate among females in the United States with a correlation coefficient (R) of -0.264 and weighted average of 4.6%. Similarly, the statistical analysis conducted on geographies consisting of 466,355,469 people shows a significant positive correlation between the proportion of Scandinavians and unemploymnet rate among females in the United States with a correlation coefficient (R) of 0.647 and weighted average of 4.6%, a difference of 0.59%.
Female Unemployment Correlation Summary
| Measurement | Dutch | Scandinavian |
| Minimum | 0.30% | 1.2% |
| Maximum | 12.7% | 55.6% |
| Range | 12.4% | 54.4% |
| Mean | 4.1% | 11.6% |
| Median | 4.2% | 4.9% |
| Interquartile 25% (IQ1) | 2.5% | 3.9% |
| Interquartile 75% (IQ3) | 4.8% | 11.5% |
| Interquartile Range (IQR) | 2.3% | 7.6% |
| Standard Deviation (Sample) | 2.2% | 13.9% |
| Standard Deviation (Population) | 2.2% | 13.7% |
Demographics Similar to Dutch and Scandinavians by Female Unemployment
In terms of female unemployment, the demographic groups most similar to Dutch are Belgian (4.6%, a difference of 0.15%), Swiss (4.6%, a difference of 0.71%), Finnish (4.6%, a difference of 0.75%), English (4.6%, a difference of 0.94%), and Carpatho Rusyn (4.7%, a difference of 1.8%). Similarly, the demographic groups most similar to Scandinavians are Swiss (4.6%, a difference of 0.11%), Belgian (4.6%, a difference of 0.75%), Finnish (4.6%, a difference of 1.3%), Slovene (4.5%, a difference of 1.4%), and English (4.6%, a difference of 1.5%).
| Demographics | Rating | Rank | Female Unemployment |
| Norwegians | 100.0 /100 | #1 | Exceptional 4.2% |
| Czechs | 100.0 /100 | #2 | Exceptional 4.4% |
| Luxembourgers | 100.0 /100 | #3 | Exceptional 4.4% |
| Danes | 100.0 /100 | #4 | Exceptional 4.4% |
| Hmong | 100.0 /100 | #5 | Exceptional 4.4% |
| Swedes | 100.0 /100 | #6 | Exceptional 4.4% |
| Chinese | 100.0 /100 | #7 | Exceptional 4.5% |
| Germans | 100.0 /100 | #8 | Exceptional 4.5% |
| Slovenes | 100.0 /100 | #9 | Exceptional 4.5% |
| Swiss | 100.0 /100 | #10 | Exceptional 4.6% |
| Scandinavians | 100.0 /100 | #11 | Exceptional 4.6% |
| Dutch | 100.0 /100 | #12 | Exceptional 4.6% |
| Belgians | 100.0 /100 | #13 | Exceptional 4.6% |
| Finns | 100.0 /100 | #14 | Exceptional 4.6% |
| English | 100.0 /100 | #15 | Exceptional 4.6% |
| Carpatho Rusyns | 99.9 /100 | #16 | Exceptional 4.7% |
| Croatians | 99.9 /100 | #17 | Exceptional 4.7% |
| Latvians | 99.9 /100 | #18 | Exceptional 4.7% |
| Poles | 99.9 /100 | #19 | Exceptional 4.7% |
| Bulgarians | 99.9 /100 | #20 | Exceptional 4.7% |
| Fijians | 99.9 /100 | #21 | Exceptional 4.7% |