Dominican vs Pueblo Unemployment Among Ages 16 to 19 years
COMPARE
Dominican
Pueblo
Unemployment Among Ages 16 to 19 years
Unemployment Among Ages 16 to 19 years Comparison
Dominicans
Pueblo
23.6%
UNEMPLOYMENT AMONG AGES 16 TO 19 YEARS
0.0/ 100
METRIC RATING
330th/ 347
METRIC RANK
19.8%
UNEMPLOYMENT AMONG AGES 16 TO 19 YEARS
0.0/ 100
METRIC RATING
289th/ 347
METRIC RANK
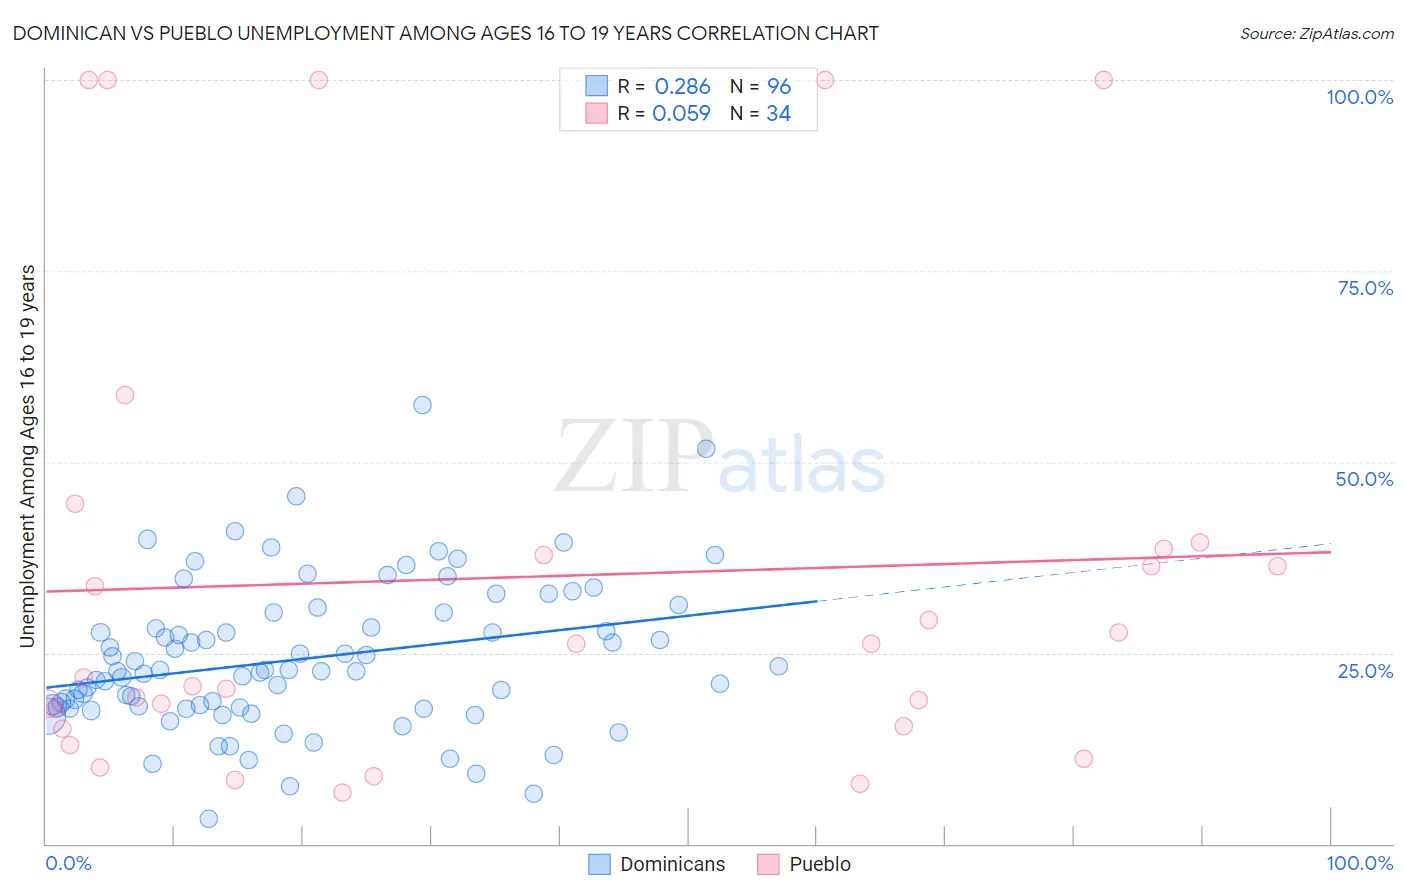
Dominican vs Pueblo Unemployment Among Ages 16 to 19 years Correlation Chart
The statistical analysis conducted on geographies consisting of 338,410,900 people shows a weak positive correlation between the proportion of Dominicans and unemployment rate among population between the ages 16 and 19 in the United States with a correlation coefficient (R) of 0.286 and weighted average of 23.6%. Similarly, the statistical analysis conducted on geographies consisting of 118,076,082 people shows a slight positive correlation between the proportion of Pueblo and unemployment rate among population between the ages 16 and 19 in the United States with a correlation coefficient (R) of 0.059 and weighted average of 19.8%, a difference of 19.1%.
Unemployment Among Ages 16 to 19 years Correlation Summary
| Measurement | Dominican | Pueblo |
| Minimum | 3.2% | 6.7% |
| Maximum | 57.4% | 100.0% |
| Range | 54.2% | 93.3% |
| Mean | 24.2% | 34.9% |
| Median | 22.6% | 24.0% |
| Interquartile 25% (IQ1) | 17.8% | 15.4% |
| Interquartile 75% (IQ3) | 29.3% | 38.6% |
| Interquartile Range (IQR) | 11.4% | 23.2% |
| Standard Deviation (Sample) | 9.6% | 29.9% |
| Standard Deviation (Population) | 9.6% | 29.4% |
Similar Demographics by Unemployment Among Ages 16 to 19 years
Demographics Similar to Dominicans by Unemployment Among Ages 16 to 19 years
In terms of unemployment among ages 16 to 19 years, the demographic groups most similar to Dominicans are Tlingit-Haida (23.5%, a difference of 0.44%), British West Indian (24.0%, a difference of 1.4%), Immigrants from Dominican Republic (23.3%, a difference of 1.5%), Immigrants from Barbados (24.0%, a difference of 1.6%), and Pima (23.1%, a difference of 2.2%).
| Demographics | Rating | Rank | Unemployment Among Ages 16 to 19 years |
| Yakama | 0.0 /100 | #323 | Tragic 22.5% |
| Immigrants | Armenia | 0.0 /100 | #324 | Tragic 22.6% |
| Trinidadians and Tobagonians | 0.0 /100 | #325 | Tragic 22.6% |
| Immigrants | Trinidad and Tobago | 0.0 /100 | #326 | Tragic 23.1% |
| Pima | 0.0 /100 | #327 | Tragic 23.1% |
| Immigrants | Dominican Republic | 0.0 /100 | #328 | Tragic 23.3% |
| Tlingit-Haida | 0.0 /100 | #329 | Tragic 23.5% |
| Dominicans | 0.0 /100 | #330 | Tragic 23.6% |
| British West Indians | 0.0 /100 | #331 | Tragic 24.0% |
| Immigrants | Barbados | 0.0 /100 | #332 | Tragic 24.0% |
| Paiute | 0.0 /100 | #333 | Tragic 24.4% |
| Guyanese | 0.0 /100 | #334 | Tragic 24.8% |
| Arapaho | 0.0 /100 | #335 | Tragic 25.2% |
| Kiowa | 0.0 /100 | #336 | Tragic 25.2% |
| Immigrants | Guyana | 0.0 /100 | #337 | Tragic 25.5% |
Demographics Similar to Pueblo by Unemployment Among Ages 16 to 19 years
In terms of unemployment among ages 16 to 19 years, the demographic groups most similar to Pueblo are Immigrants from the Azores (19.8%, a difference of 0.17%), Immigrants from Ghana (19.8%, a difference of 0.29%), Bahamian (19.8%, a difference of 0.35%), Ghanaian (19.8%, a difference of 0.48%), and Immigrants from Sierra Leone (20.0%, a difference of 0.53%).
| Demographics | Rating | Rank | Unemployment Among Ages 16 to 19 years |
| Dutch West Indians | 0.0 /100 | #282 | Tragic 19.7% |
| Sioux | 0.0 /100 | #283 | Tragic 19.7% |
| Sierra Leoneans | 0.0 /100 | #284 | Tragic 19.7% |
| Ghanaians | 0.0 /100 | #285 | Tragic 19.8% |
| Bahamians | 0.0 /100 | #286 | Tragic 19.8% |
| Immigrants | Ghana | 0.0 /100 | #287 | Tragic 19.8% |
| Immigrants | Azores | 0.0 /100 | #288 | Tragic 19.8% |
| Pueblo | 0.0 /100 | #289 | Tragic 19.8% |
| Immigrants | Sierra Leone | 0.0 /100 | #290 | Tragic 20.0% |
| Immigrants | Yemen | 0.0 /100 | #291 | Tragic 20.0% |
| Comanche | 0.0 /100 | #292 | Tragic 20.2% |
| Immigrants | Bahamas | 0.0 /100 | #293 | Tragic 20.4% |
| Immigrants | Haiti | 0.0 /100 | #294 | Tragic 20.4% |
| Central American Indians | 0.0 /100 | #295 | Tragic 20.4% |
| Armenians | 0.0 /100 | #296 | Tragic 20.5% |