Dominican vs Nonimmigrants Unemployment Among Ages 60 to 64 years
COMPARE
Dominican
Nonimmigrants
Unemployment Among Ages 60 to 64 years
Unemployment Among Ages 60 to 64 years Comparison
Dominicans
Nonimmigrants
6.0%
UNEMPLOYMENT AMONG AGES 60 TO 64 YEARS
0.0/ 100
METRIC RATING
332nd/ 347
METRIC RANK
4.9%
UNEMPLOYMENT AMONG AGES 60 TO 64 YEARS
44.5/ 100
METRIC RATING
178th/ 347
METRIC RANK
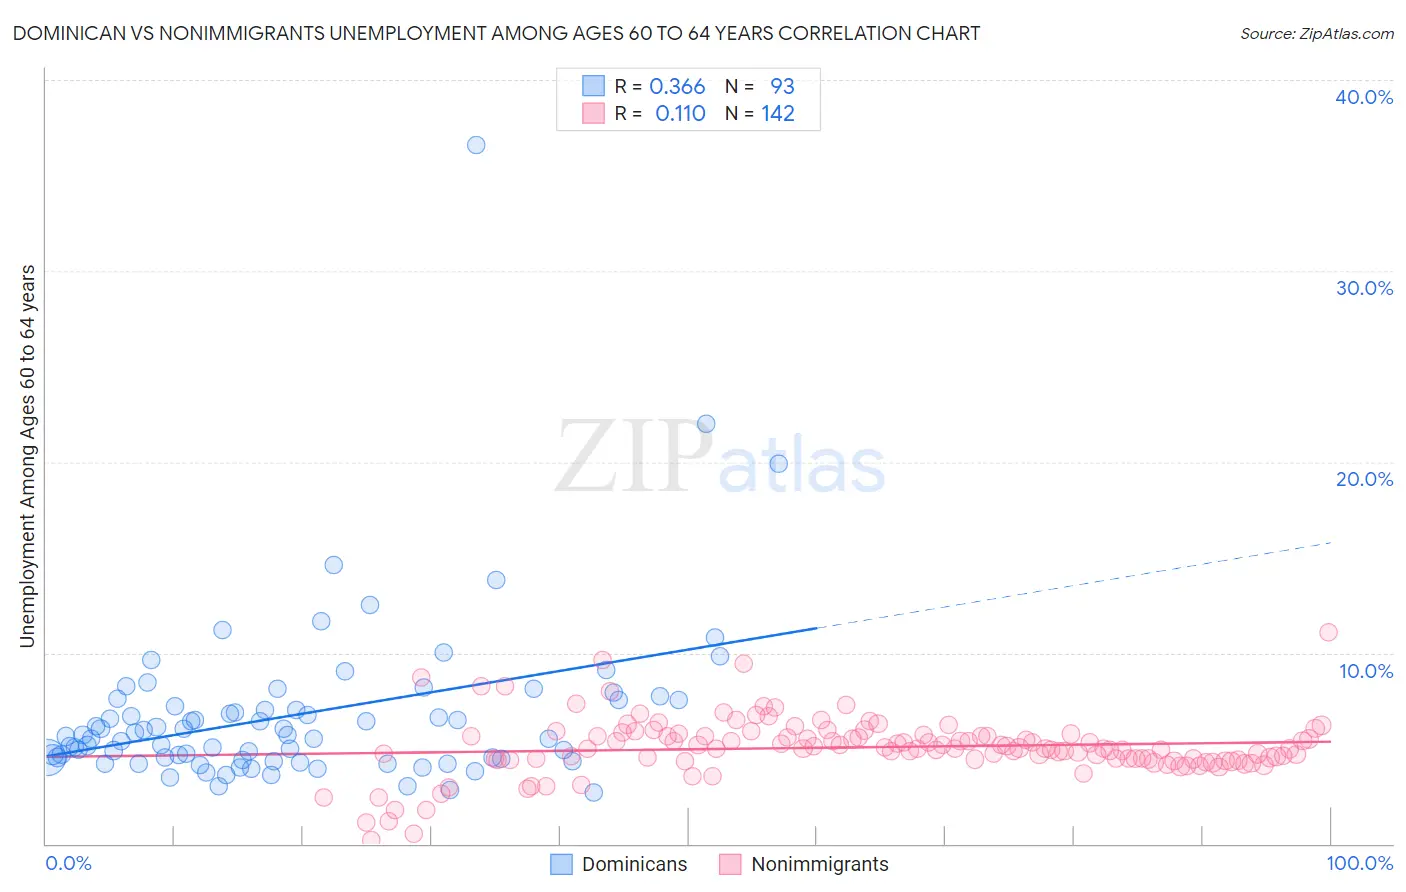
Dominican vs Nonimmigrants Unemployment Among Ages 60 to 64 years Correlation Chart
The statistical analysis conducted on geographies consisting of 324,520,720 people shows a mild positive correlation between the proportion of Dominicans and unemployment rate among population between the ages 60 and 64 in the United States with a correlation coefficient (R) of 0.366 and weighted average of 6.0%. Similarly, the statistical analysis conducted on geographies consisting of 470,219,592 people shows a poor positive correlation between the proportion of Nonimmigrants and unemployment rate among population between the ages 60 and 64 in the United States with a correlation coefficient (R) of 0.110 and weighted average of 4.9%, a difference of 22.8%.
Unemployment Among Ages 60 to 64 years Correlation Summary
| Measurement | Dominican | Nonimmigrants |
| Minimum | 2.7% | 0.20% |
| Maximum | 36.6% | 11.1% |
| Range | 33.9% | 10.9% |
| Mean | 6.8% | 5.1% |
| Median | 5.7% | 5.0% |
| Interquartile 25% (IQ1) | 4.5% | 4.4% |
| Interquartile 75% (IQ3) | 7.5% | 5.6% |
| Interquartile Range (IQR) | 3.0% | 1.2% |
| Standard Deviation (Sample) | 4.5% | 1.6% |
| Standard Deviation (Population) | 4.4% | 1.5% |
Similar Demographics by Unemployment Among Ages 60 to 64 years
Demographics Similar to Dominicans by Unemployment Among Ages 60 to 64 years
In terms of unemployment among ages 60 to 64 years, the demographic groups most similar to Dominicans are Yakama (6.0%, a difference of 0.020%), Immigrants from Armenia (6.0%, a difference of 0.16%), Immigrants from Dominican Republic (6.0%, a difference of 0.35%), Immigrants from Bangladesh (6.0%, a difference of 0.42%), and Apache (6.0%, a difference of 0.43%).
| Demographics | Rating | Rank | Unemployment Among Ages 60 to 64 years |
| Paiute | 0.0 /100 | #325 | Tragic 5.8% |
| Immigrants | St. Vincent and the Grenadines | 0.0 /100 | #326 | Tragic 5.9% |
| Immigrants | Grenada | 0.0 /100 | #327 | Tragic 5.9% |
| Apache | 0.0 /100 | #328 | Tragic 6.0% |
| Immigrants | Bangladesh | 0.0 /100 | #329 | Tragic 6.0% |
| Immigrants | Armenia | 0.0 /100 | #330 | Tragic 6.0% |
| Yakama | 0.0 /100 | #331 | Tragic 6.0% |
| Dominicans | 0.0 /100 | #332 | Tragic 6.0% |
| Immigrants | Dominican Republic | 0.0 /100 | #333 | Tragic 6.0% |
| Puerto Ricans | 0.0 /100 | #334 | Tragic 6.1% |
| Vietnamese | 0.0 /100 | #335 | Tragic 6.1% |
| Kiowa | 0.0 /100 | #336 | Tragic 6.2% |
| Navajo | 0.0 /100 | #337 | Tragic 6.3% |
| Arapaho | 0.0 /100 | #338 | Tragic 6.3% |
| Tlingit-Haida | 0.0 /100 | #339 | Tragic 6.4% |
Demographics Similar to Nonimmigrants by Unemployment Among Ages 60 to 64 years
In terms of unemployment among ages 60 to 64 years, the demographic groups most similar to Nonimmigrants are Immigrants from Malaysia (4.9%, a difference of 0.010%), Immigrants from Sweden (4.9%, a difference of 0.010%), Bermudan (4.9%, a difference of 0.070%), Immigrants from Latvia (4.9%, a difference of 0.080%), and Asian (4.9%, a difference of 0.13%).
| Demographics | Rating | Rank | Unemployment Among Ages 60 to 64 years |
| Samoans | 53.6 /100 | #171 | Average 4.9% |
| Immigrants | Turkey | 52.8 /100 | #172 | Average 4.9% |
| Immigrants | Hungary | 50.2 /100 | #173 | Average 4.9% |
| Immigrants | Western Europe | 50.0 /100 | #174 | Average 4.9% |
| Immigrants | Latvia | 46.9 /100 | #175 | Average 4.9% |
| Bermudans | 46.5 /100 | #176 | Average 4.9% |
| Immigrants | Malaysia | 44.7 /100 | #177 | Average 4.9% |
| Immigrants | Nonimmigrants | 44.5 /100 | #178 | Average 4.9% |
| Immigrants | Sweden | 44.3 /100 | #179 | Average 4.9% |
| Asians | 40.8 /100 | #180 | Average 4.9% |
| Hungarians | 40.6 /100 | #181 | Average 4.9% |
| Sri Lankans | 39.8 /100 | #182 | Fair 4.9% |
| Sub-Saharan Africans | 38.9 /100 | #183 | Fair 4.9% |
| Immigrants | Ukraine | 37.6 /100 | #184 | Fair 4.9% |
| Ute | 37.4 /100 | #185 | Fair 4.9% |