Delaware vs French Canadian Unemployment
COMPARE
Delaware
French Canadian
Unemployment
Unemployment Comparison
Delaware
French Canadians
5.4%
UNEMPLOYMENT
14.7/ 100
METRIC RATING
215th/ 347
METRIC RANK
4.9%
UNEMPLOYMENT
99.3/ 100
METRIC RATING
50th/ 347
METRIC RANK
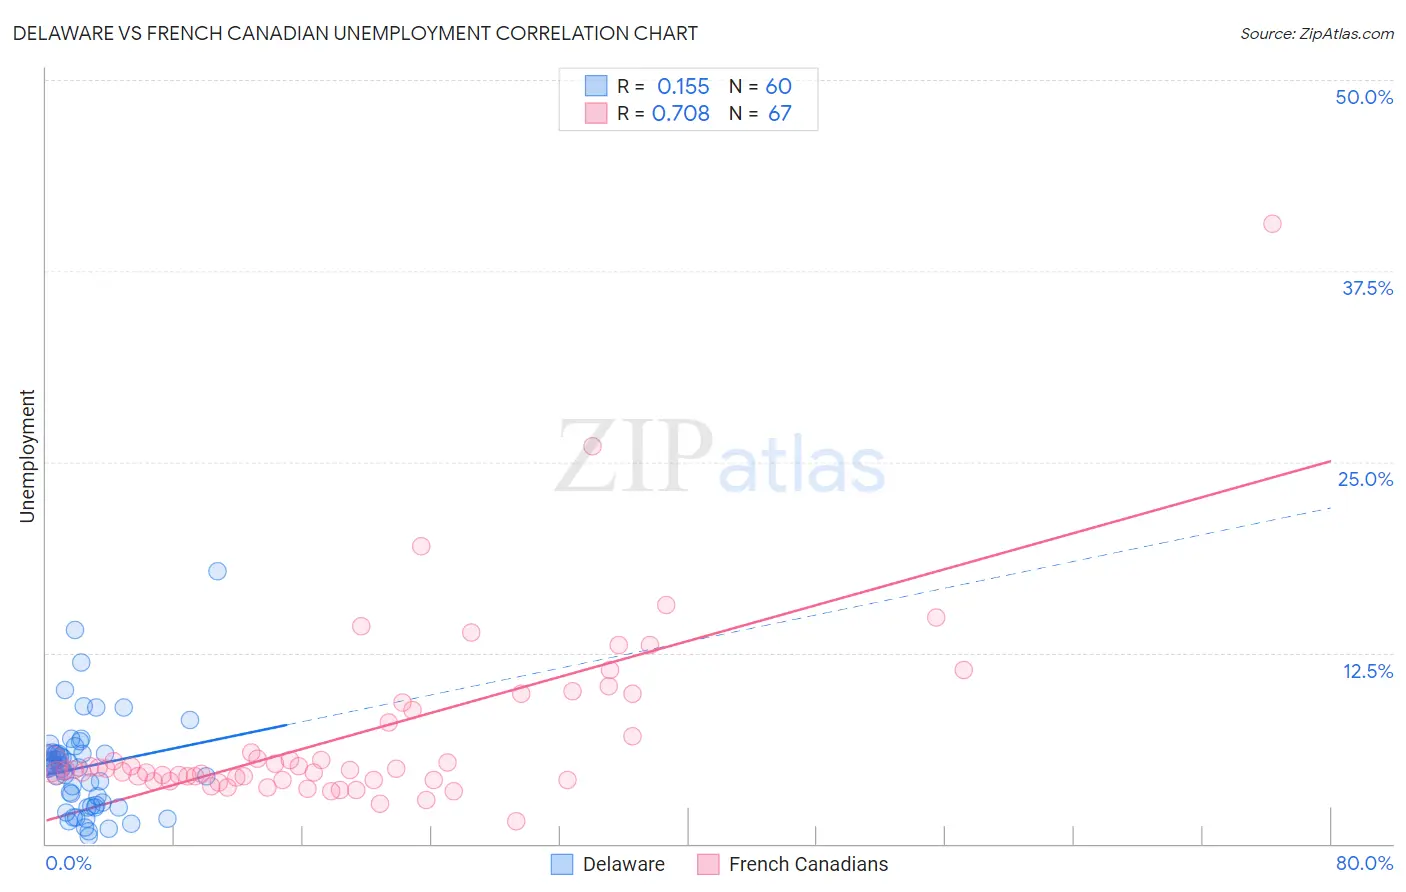
Delaware vs French Canadian Unemployment Correlation Chart
The statistical analysis conducted on geographies consisting of 96,217,078 people shows a poor positive correlation between the proportion of Delaware and unemployment in the United States with a correlation coefficient (R) of 0.155 and weighted average of 5.4%. Similarly, the statistical analysis conducted on geographies consisting of 500,867,403 people shows a strong positive correlation between the proportion of French Canadians and unemployment in the United States with a correlation coefficient (R) of 0.708 and weighted average of 4.9%, a difference of 11.1%.
Unemployment Correlation Summary
| Measurement | Delaware | French Canadian |
| Minimum | 0.50% | 1.5% |
| Maximum | 17.8% | 40.6% |
| Range | 17.3% | 39.1% |
| Mean | 5.0% | 7.1% |
| Median | 5.0% | 4.9% |
| Interquartile 25% (IQ1) | 2.5% | 4.2% |
| Interquartile 75% (IQ3) | 5.9% | 8.7% |
| Interquartile Range (IQR) | 3.4% | 4.5% |
| Standard Deviation (Sample) | 3.2% | 6.0% |
| Standard Deviation (Population) | 3.2% | 6.0% |
Similar Demographics by Unemployment
Demographics Similar to Delaware by Unemployment
In terms of unemployment, the demographic groups most similar to Delaware are Immigrants from Middle Africa (5.4%, a difference of 0.060%), Immigrants from Costa Rica (5.4%, a difference of 0.060%), Immigrants from South America (5.4%, a difference of 0.16%), Immigrants from Albania (5.4%, a difference of 0.16%), and Choctaw (5.4%, a difference of 0.26%).
| Demographics | Rating | Rank | Unemployment |
| Portuguese | 19.0 /100 | #208 | Poor 5.4% |
| Immigrants | Iran | 18.8 /100 | #209 | Poor 5.4% |
| Immigrants | Iraq | 18.6 /100 | #210 | Poor 5.4% |
| Iraqis | 18.1 /100 | #211 | Poor 5.4% |
| Ugandans | 18.0 /100 | #212 | Poor 5.4% |
| Immigrants | Middle Africa | 15.3 /100 | #213 | Poor 5.4% |
| Immigrants | Costa Rica | 15.2 /100 | #214 | Poor 5.4% |
| Delaware | 14.7 /100 | #215 | Poor 5.4% |
| Immigrants | South America | 13.5 /100 | #216 | Poor 5.4% |
| Immigrants | Albania | 13.5 /100 | #217 | Poor 5.4% |
| Choctaw | 12.7 /100 | #218 | Poor 5.4% |
| Bangladeshis | 11.2 /100 | #219 | Poor 5.4% |
| Soviet Union | 10.6 /100 | #220 | Poor 5.4% |
| Immigrants | Philippines | 10.4 /100 | #221 | Poor 5.4% |
| Iroquois | 10.3 /100 | #222 | Poor 5.4% |
Demographics Similar to French Canadians by Unemployment
In terms of unemployment, the demographic groups most similar to French Canadians are Immigrants from South Central Asia (4.9%, a difference of 0.020%), Immigrants from Scotland (4.9%, a difference of 0.030%), Immigrants from Belgium (4.9%, a difference of 0.16%), White/Caucasian (4.9%, a difference of 0.17%), and Immigrants from Zimbabwe (4.9%, a difference of 0.20%).
| Demographics | Rating | Rank | Unemployment |
| Yugoslavians | 99.5 /100 | #43 | Exceptional 4.8% |
| Austrians | 99.5 /100 | #44 | Exceptional 4.8% |
| French | 99.5 /100 | #45 | Exceptional 4.8% |
| Immigrants | Nepal | 99.4 /100 | #46 | Exceptional 4.8% |
| Immigrants | Taiwan | 99.4 /100 | #47 | Exceptional 4.8% |
| Immigrants | Scotland | 99.3 /100 | #48 | Exceptional 4.9% |
| Immigrants | South Central Asia | 99.3 /100 | #49 | Exceptional 4.9% |
| French Canadians | 99.3 /100 | #50 | Exceptional 4.9% |
| Immigrants | Belgium | 99.2 /100 | #51 | Exceptional 4.9% |
| Whites/Caucasians | 99.2 /100 | #52 | Exceptional 4.9% |
| Immigrants | Zimbabwe | 99.2 /100 | #53 | Exceptional 4.9% |
| Eastern Europeans | 99.2 /100 | #54 | Exceptional 4.9% |
| Australians | 99.2 /100 | #55 | Exceptional 4.9% |
| Celtics | 99.1 /100 | #56 | Exceptional 4.9% |
| Immigrants | Singapore | 99.1 /100 | #57 | Exceptional 4.9% |