Delaware vs Chickasaw Unemployment Among Ages 25 to 29 years
COMPARE
Delaware
Chickasaw
Unemployment Among Ages 25 to 29 years
Unemployment Among Ages 25 to 29 years Comparison
Delaware
Chickasaw
7.2%
UNEMPLOYMENT AMONG AGES 25 TO 29 YEARS
0.5/ 100
METRIC RATING
250th/ 347
METRIC RANK
6.7%
UNEMPLOYMENT AMONG AGES 25 TO 29 YEARS
28.7/ 100
METRIC RATING
191st/ 347
METRIC RANK
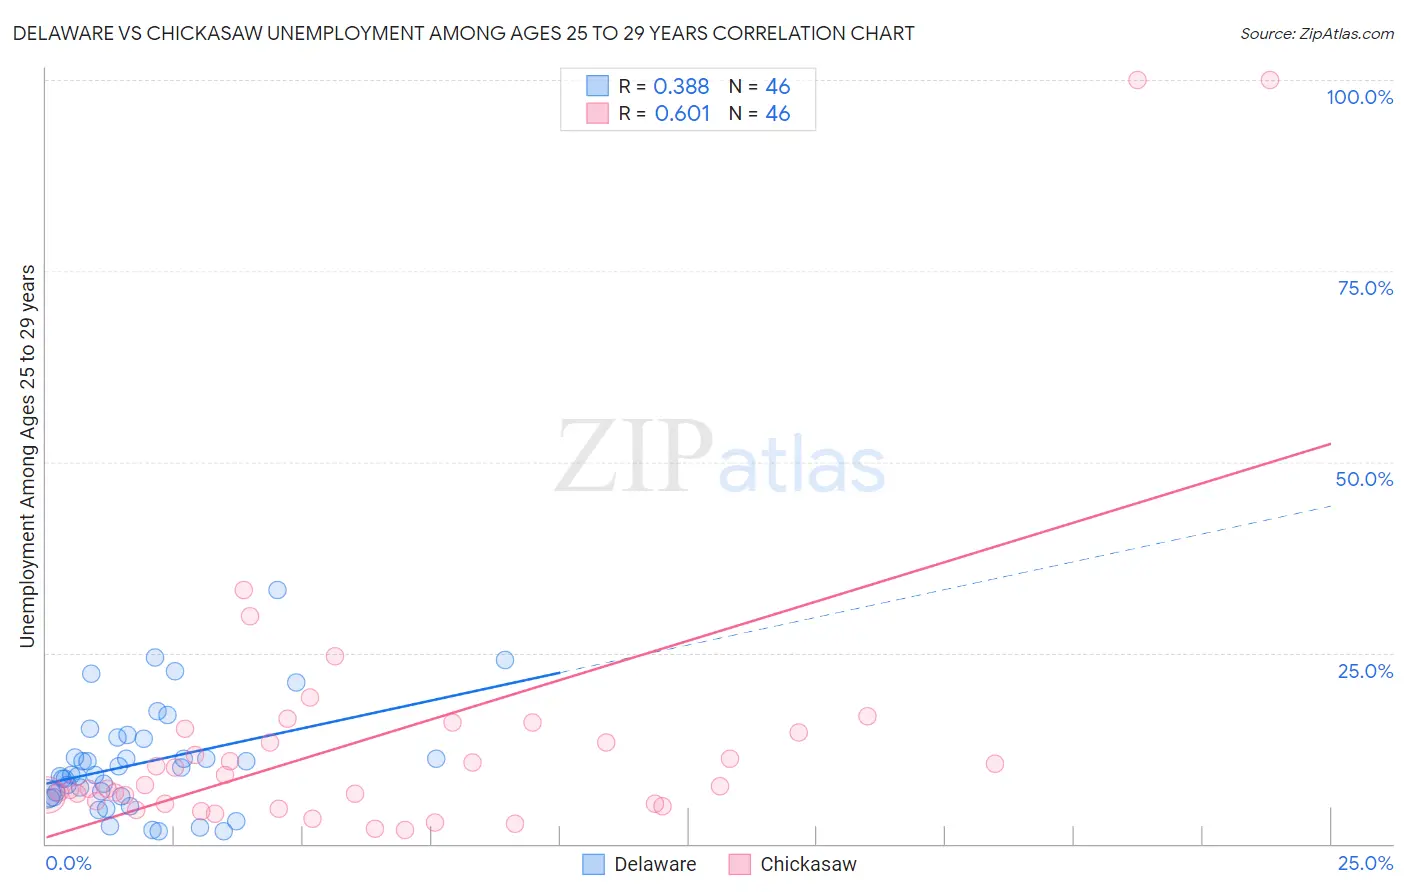
Delaware vs Chickasaw Unemployment Among Ages 25 to 29 years Correlation Chart
The statistical analysis conducted on geographies consisting of 94,295,691 people shows a mild positive correlation between the proportion of Delaware and unemployment rate among population between the ages 25 and 29 in the United States with a correlation coefficient (R) of 0.388 and weighted average of 7.2%. Similarly, the statistical analysis conducted on geographies consisting of 143,774,961 people shows a significant positive correlation between the proportion of Chickasaw and unemployment rate among population between the ages 25 and 29 in the United States with a correlation coefficient (R) of 0.601 and weighted average of 6.7%, a difference of 6.6%.
Unemployment Among Ages 25 to 29 years Correlation Summary
| Measurement | Delaware | Chickasaw |
| Minimum | 1.6% | 1.8% |
| Maximum | 33.3% | 100.0% |
| Range | 31.7% | 98.2% |
| Mean | 10.6% | 13.9% |
| Median | 9.0% | 7.6% |
| Interquartile 25% (IQ1) | 6.3% | 5.2% |
| Interquartile 75% (IQ3) | 13.8% | 14.6% |
| Interquartile Range (IQR) | 7.5% | 9.4% |
| Standard Deviation (Sample) | 6.9% | 19.8% |
| Standard Deviation (Population) | 6.8% | 19.6% |
Similar Demographics by Unemployment Among Ages 25 to 29 years
Demographics Similar to Delaware by Unemployment Among Ages 25 to 29 years
In terms of unemployment among ages 25 to 29 years, the demographic groups most similar to Delaware are Portuguese (7.2%, a difference of 0.060%), Seminole (7.2%, a difference of 0.16%), Subsaharan African (7.2%, a difference of 0.19%), Sierra Leonean (7.2%, a difference of 0.31%), and Immigrants from Guatemala (7.2%, a difference of 0.35%).
| Demographics | Rating | Rank | Unemployment Among Ages 25 to 29 years |
| Yaqui | 1.0 /100 | #243 | Tragic 7.1% |
| Immigrants | Nonimmigrants | 0.9 /100 | #244 | Tragic 7.1% |
| Guatemalans | 0.9 /100 | #245 | Tragic 7.1% |
| Immigrants | Uzbekistan | 0.7 /100 | #246 | Tragic 7.2% |
| Immigrants | Guatemala | 0.7 /100 | #247 | Tragic 7.2% |
| Sub-Saharan Africans | 0.6 /100 | #248 | Tragic 7.2% |
| Seminole | 0.6 /100 | #249 | Tragic 7.2% |
| Delaware | 0.5 /100 | #250 | Tragic 7.2% |
| Portuguese | 0.5 /100 | #251 | Tragic 7.2% |
| Sierra Leoneans | 0.4 /100 | #252 | Tragic 7.2% |
| Immigrants | Portugal | 0.3 /100 | #253 | Tragic 7.2% |
| Ghanaians | 0.3 /100 | #254 | Tragic 7.2% |
| Immigrants | Cameroon | 0.3 /100 | #255 | Tragic 7.2% |
| Mexican American Indians | 0.3 /100 | #256 | Tragic 7.3% |
| Assyrians/Chaldeans/Syriacs | 0.2 /100 | #257 | Tragic 7.3% |
Demographics Similar to Chickasaw by Unemployment Among Ages 25 to 29 years
In terms of unemployment among ages 25 to 29 years, the demographic groups most similar to Chickasaw are Immigrants from Ukraine (6.7%, a difference of 0.010%), Korean (6.7%, a difference of 0.040%), Alsatian (6.7%, a difference of 0.050%), Immigrants from Greece (6.7%, a difference of 0.050%), and Immigrants from Western Asia (6.7%, a difference of 0.10%).
| Demographics | Rating | Rank | Unemployment Among Ages 25 to 29 years |
| Immigrants | Costa Rica | 38.3 /100 | #184 | Fair 6.7% |
| Moroccans | 35.9 /100 | #185 | Fair 6.7% |
| Immigrants | Iran | 34.4 /100 | #186 | Fair 6.7% |
| Immigrants | South America | 33.0 /100 | #187 | Fair 6.7% |
| Irish | 32.8 /100 | #188 | Fair 6.7% |
| Argentineans | 32.1 /100 | #189 | Fair 6.7% |
| Koreans | 29.3 /100 | #190 | Fair 6.7% |
| Chickasaw | 28.7 /100 | #191 | Fair 6.7% |
| Immigrants | Ukraine | 28.6 /100 | #192 | Fair 6.7% |
| Alsatians | 28.1 /100 | #193 | Fair 6.7% |
| Immigrants | Greece | 28.0 /100 | #194 | Fair 6.7% |
| Immigrants | Western Asia | 27.3 /100 | #195 | Fair 6.7% |
| Hungarians | 26.8 /100 | #196 | Fair 6.8% |
| Italians | 26.5 /100 | #197 | Fair 6.8% |
| Immigrants | Southern Europe | 24.6 /100 | #198 | Fair 6.8% |