Danish vs U.S. Virgin Islander Unemployment Among Ages 30 to 34 years
COMPARE
Danish
U.S. Virgin Islander
Unemployment Among Ages 30 to 34 years
Unemployment Among Ages 30 to 34 years Comparison
Danes
U.S. Virgin Islanders
5.0%
UNEMPLOYMENT AMONG AGES 30 TO 34 YEARS
99.5/ 100
METRIC RATING
27th/ 347
METRIC RANK
6.3%
UNEMPLOYMENT AMONG AGES 30 TO 34 YEARS
0.0/ 100
METRIC RATING
274th/ 347
METRIC RANK
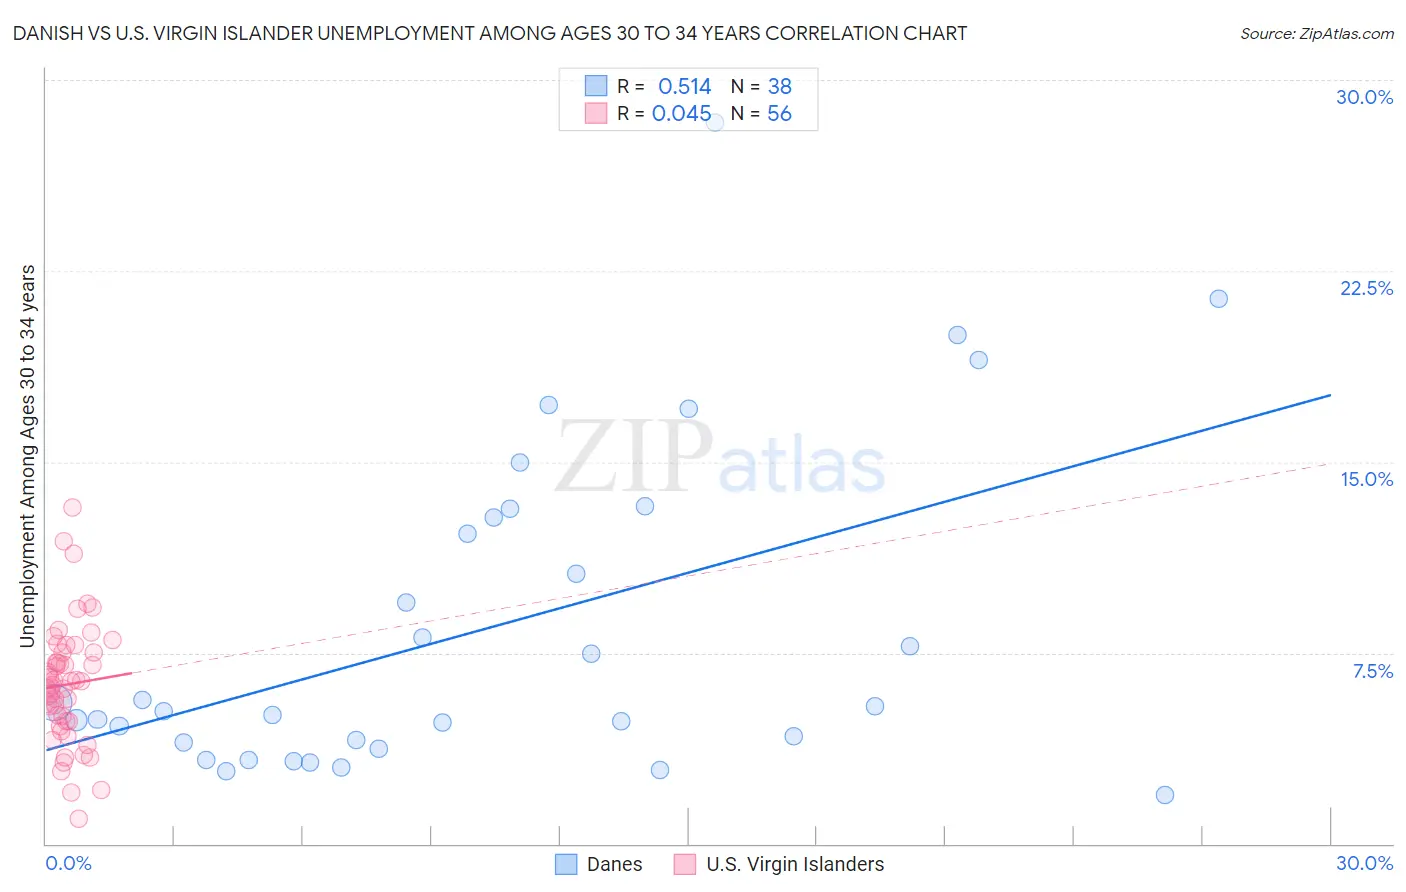
Danish vs U.S. Virgin Islander Unemployment Among Ages 30 to 34 years Correlation Chart
The statistical analysis conducted on geographies consisting of 429,862,227 people shows a substantial positive correlation between the proportion of Danes and unemployment rate among population between the ages 30 and 34 in the United States with a correlation coefficient (R) of 0.514 and weighted average of 5.0%. Similarly, the statistical analysis conducted on geographies consisting of 86,615,171 people shows no correlation between the proportion of U.S. Virgin Islanders and unemployment rate among population between the ages 30 and 34 in the United States with a correlation coefficient (R) of 0.045 and weighted average of 6.3%, a difference of 26.3%.
Unemployment Among Ages 30 to 34 years Correlation Summary
| Measurement | Danish | U.S. Virgin Islander |
| Minimum | 1.9% | 1.0% |
| Maximum | 28.3% | 13.2% |
| Range | 26.4% | 12.2% |
| Mean | 8.5% | 6.3% |
| Median | 5.3% | 6.3% |
| Interquartile 25% (IQ1) | 4.0% | 4.8% |
| Interquartile 75% (IQ3) | 12.8% | 7.5% |
| Interquartile Range (IQR) | 8.8% | 2.7% |
| Standard Deviation (Sample) | 6.4% | 2.3% |
| Standard Deviation (Population) | 6.3% | 2.3% |
Similar Demographics by Unemployment Among Ages 30 to 34 years
Demographics Similar to Danes by Unemployment Among Ages 30 to 34 years
In terms of unemployment among ages 30 to 34 years, the demographic groups most similar to Danes are Immigrants from Kuwait (5.0%, a difference of 0.11%), Immigrants from Cuba (5.0%, a difference of 0.24%), German Russian (5.0%, a difference of 0.26%), Immigrants from Singapore (5.0%, a difference of 0.27%), and Norwegian (5.0%, a difference of 0.28%).
| Demographics | Rating | Rank | Unemployment Among Ages 30 to 34 years |
| Immigrants | Taiwan | 99.8 /100 | #20 | Exceptional 4.9% |
| Ethiopians | 99.8 /100 | #21 | Exceptional 4.9% |
| Immigrants | South Central Asia | 99.8 /100 | #22 | Exceptional 4.9% |
| Hmong | 99.8 /100 | #23 | Exceptional 4.9% |
| Ugandans | 99.7 /100 | #24 | Exceptional 4.9% |
| Immigrants | Singapore | 99.5 /100 | #25 | Exceptional 5.0% |
| Immigrants | Kuwait | 99.5 /100 | #26 | Exceptional 5.0% |
| Danes | 99.5 /100 | #27 | Exceptional 5.0% |
| Immigrants | Cuba | 99.4 /100 | #28 | Exceptional 5.0% |
| German Russians | 99.4 /100 | #29 | Exceptional 5.0% |
| Norwegians | 99.4 /100 | #30 | Exceptional 5.0% |
| Somalis | 99.3 /100 | #31 | Exceptional 5.0% |
| Immigrants | Zaire | 99.3 /100 | #32 | Exceptional 5.0% |
| Immigrants | Saudi Arabia | 99.3 /100 | #33 | Exceptional 5.0% |
| Latvians | 99.3 /100 | #34 | Exceptional 5.0% |
Demographics Similar to U.S. Virgin Islanders by Unemployment Among Ages 30 to 34 years
In terms of unemployment among ages 30 to 34 years, the demographic groups most similar to U.S. Virgin Islanders are Ottawa (6.3%, a difference of 0.010%), Blackfeet (6.3%, a difference of 0.020%), Ecuadorian (6.3%, a difference of 0.10%), Comanche (6.3%, a difference of 0.13%), and Pennsylvania German (6.3%, a difference of 0.16%).
| Demographics | Rating | Rank | Unemployment Among Ages 30 to 34 years |
| Immigrants | Mexico | 0.0 /100 | #267 | Tragic 6.2% |
| Immigrants | Haiti | 0.0 /100 | #268 | Tragic 6.2% |
| French American Indians | 0.0 /100 | #269 | Tragic 6.3% |
| Immigrants | Senegal | 0.0 /100 | #270 | Tragic 6.3% |
| Comanche | 0.0 /100 | #271 | Tragic 6.3% |
| Blackfeet | 0.0 /100 | #272 | Tragic 6.3% |
| Ottawa | 0.0 /100 | #273 | Tragic 6.3% |
| U.S. Virgin Islanders | 0.0 /100 | #274 | Tragic 6.3% |
| Ecuadorians | 0.0 /100 | #275 | Tragic 6.3% |
| Pennsylvania Germans | 0.0 /100 | #276 | Tragic 6.3% |
| Immigrants | Ecuador | 0.0 /100 | #277 | Tragic 6.3% |
| Osage | 0.0 /100 | #278 | Tragic 6.3% |
| Cree | 0.0 /100 | #279 | Tragic 6.4% |
| Cherokee | 0.0 /100 | #280 | Tragic 6.4% |
| Immigrants | Caribbean | 0.0 /100 | #281 | Tragic 6.4% |