Danish vs Trinidadian and Tobagonian Unemployment Among Women with Children Under 6 years
COMPARE
Danish
Trinidadian and Tobagonian
Unemployment Among Women with Children Under 6 years
Unemployment Among Women with Children Under 6 years Comparison
Danes
Trinidadians and Tobagonians
7.1%
UNEMPLOYMENT AMONG WOMEN WITH CHILDREN UNDER 6 YEARS
98.2/ 100
METRIC RATING
91st/ 347
METRIC RANK
8.0%
UNEMPLOYMENT AMONG WOMEN WITH CHILDREN UNDER 6 YEARS
5.3/ 100
METRIC RATING
231st/ 347
METRIC RANK
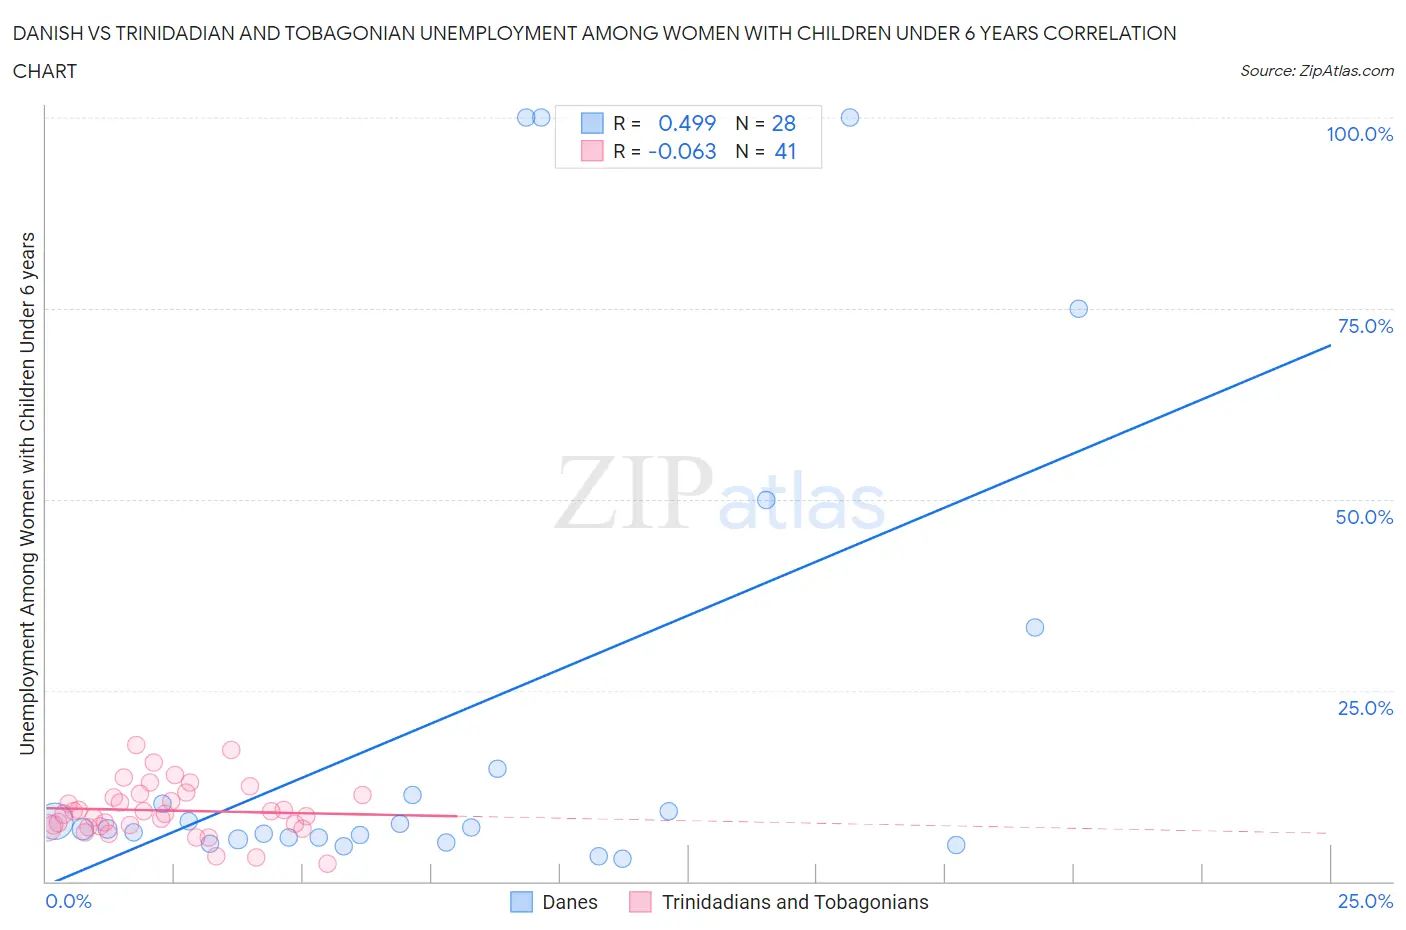
Danish vs Trinidadian and Tobagonian Unemployment Among Women with Children Under 6 years Correlation Chart
The statistical analysis conducted on geographies consisting of 332,454,296 people shows a moderate positive correlation between the proportion of Danes and unemployment rate among women with children under the age of 6 in the United States with a correlation coefficient (R) of 0.499 and weighted average of 7.1%. Similarly, the statistical analysis conducted on geographies consisting of 186,043,752 people shows a slight negative correlation between the proportion of Trinidadians and Tobagonians and unemployment rate among women with children under the age of 6 in the United States with a correlation coefficient (R) of -0.063 and weighted average of 8.0%, a difference of 12.2%.
Unemployment Among Women with Children Under 6 years Correlation Summary
| Measurement | Danish | Trinidadian and Tobagonian |
| Minimum | 3.0% | 2.3% |
| Maximum | 100.0% | 17.8% |
| Range | 97.0% | 15.5% |
| Mean | 21.7% | 9.3% |
| Median | 6.9% | 8.9% |
| Interquartile 25% (IQ1) | 5.6% | 7.2% |
| Interquartile 75% (IQ3) | 13.0% | 11.4% |
| Interquartile Range (IQR) | 7.4% | 4.2% |
| Standard Deviation (Sample) | 31.7% | 3.4% |
| Standard Deviation (Population) | 31.2% | 3.4% |
Similar Demographics by Unemployment Among Women with Children Under 6 years
Demographics Similar to Danes by Unemployment Among Women with Children Under 6 years
In terms of unemployment among women with children under 6 years, the demographic groups most similar to Danes are Immigrants from Spain (7.1%, a difference of 0.060%), Immigrants from Denmark (7.1%, a difference of 0.12%), Albanian (7.2%, a difference of 0.14%), Immigrants from Hungary (7.1%, a difference of 0.16%), and Alsatian (7.1%, a difference of 0.28%).
| Demographics | Rating | Rank | Unemployment Among Women with Children Under 6 years |
| Immigrants | Albania | 98.7 /100 | #84 | Exceptional 7.1% |
| Immigrants | Romania | 98.7 /100 | #85 | Exceptional 7.1% |
| Immigrants | Zimbabwe | 98.6 /100 | #86 | Exceptional 7.1% |
| Alsatians | 98.4 /100 | #87 | Exceptional 7.1% |
| Immigrants | Hungary | 98.3 /100 | #88 | Exceptional 7.1% |
| Immigrants | Denmark | 98.3 /100 | #89 | Exceptional 7.1% |
| Immigrants | Spain | 98.2 /100 | #90 | Exceptional 7.1% |
| Danes | 98.2 /100 | #91 | Exceptional 7.1% |
| Albanians | 98.0 /100 | #92 | Exceptional 7.2% |
| New Zealanders | 97.8 /100 | #93 | Exceptional 7.2% |
| Macedonians | 97.7 /100 | #94 | Exceptional 7.2% |
| Romanians | 97.7 /100 | #95 | Exceptional 7.2% |
| Immigrants | Eastern Africa | 97.7 /100 | #96 | Exceptional 7.2% |
| Immigrants | South Eastern Asia | 97.6 /100 | #97 | Exceptional 7.2% |
| Russians | 97.5 /100 | #98 | Exceptional 7.2% |
Demographics Similar to Trinidadians and Tobagonians by Unemployment Among Women with Children Under 6 years
In terms of unemployment among women with children under 6 years, the demographic groups most similar to Trinidadians and Tobagonians are Finnish (8.0%, a difference of 0.0%), Salvadoran (8.0%, a difference of 0.070%), Welsh (8.0%, a difference of 0.090%), Immigrants from Trinidad and Tobago (8.0%, a difference of 0.17%), and Immigrants from Sudan (8.0%, a difference of 0.22%).
| Demographics | Rating | Rank | Unemployment Among Women with Children Under 6 years |
| English | 7.2 /100 | #224 | Tragic 8.0% |
| Germans | 7.0 /100 | #225 | Tragic 8.0% |
| Senegalese | 6.2 /100 | #226 | Tragic 8.0% |
| Portuguese | 6.2 /100 | #227 | Tragic 8.0% |
| Immigrants | Sudan | 6.0 /100 | #228 | Tragic 8.0% |
| Salvadorans | 5.5 /100 | #229 | Tragic 8.0% |
| Finns | 5.3 /100 | #230 | Tragic 8.0% |
| Trinidadians and Tobagonians | 5.3 /100 | #231 | Tragic 8.0% |
| Welsh | 5.0 /100 | #232 | Tragic 8.0% |
| Immigrants | Trinidad and Tobago | 4.8 /100 | #233 | Tragic 8.0% |
| Kiowa | 4.4 /100 | #234 | Tragic 8.0% |
| Comanche | 4.3 /100 | #235 | Tragic 8.0% |
| Immigrants | Barbados | 4.2 /100 | #236 | Tragic 8.0% |
| Immigrants | Costa Rica | 4.1 /100 | #237 | Tragic 8.0% |
| Immigrants | Middle Africa | 3.2 /100 | #238 | Tragic 8.1% |