Czech vs Venezuelan Unemployment Among Ages 20 to 24 years
COMPARE
Czech
Venezuelan
Unemployment Among Ages 20 to 24 years
Unemployment Among Ages 20 to 24 years Comparison
Czechs
Venezuelans
9.3%
UNEMPLOYMENT AMONG AGES 20 TO 24 YEARS
100.0/ 100
METRIC RATING
17th/ 347
METRIC RANK
9.0%
UNEMPLOYMENT AMONG AGES 20 TO 24 YEARS
100.0/ 100
METRIC RATING
4th/ 347
METRIC RANK
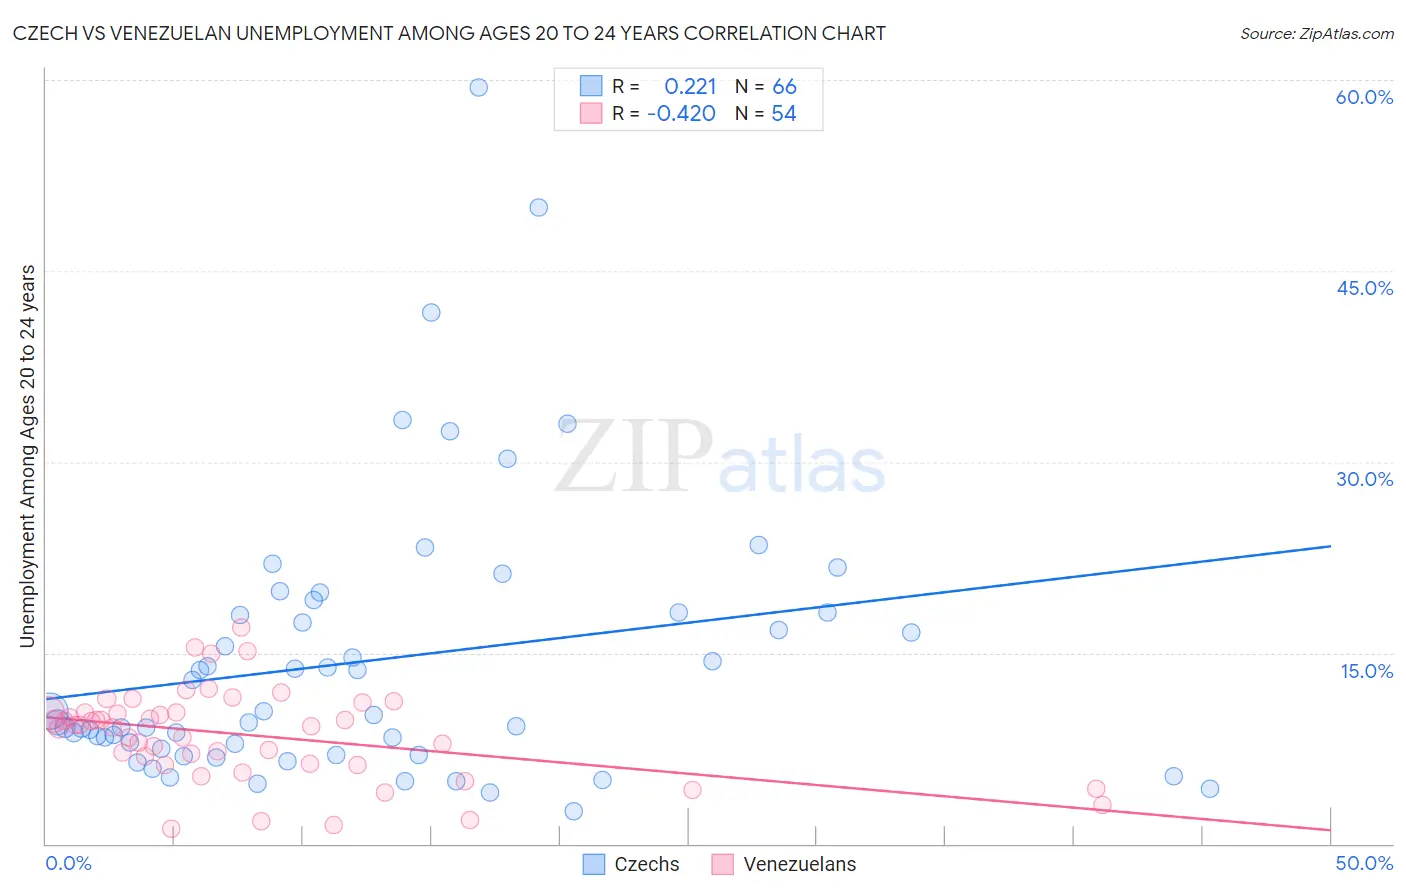
Czech vs Venezuelan Unemployment Among Ages 20 to 24 years Correlation Chart
The statistical analysis conducted on geographies consisting of 456,027,533 people shows a weak positive correlation between the proportion of Czechs and unemployment rate among population between the ages 20 and 24 in the United States with a correlation coefficient (R) of 0.221 and weighted average of 9.3%. Similarly, the statistical analysis conducted on geographies consisting of 300,469,812 people shows a moderate negative correlation between the proportion of Venezuelans and unemployment rate among population between the ages 20 and 24 in the United States with a correlation coefficient (R) of -0.420 and weighted average of 9.0%, a difference of 3.5%.
Unemployment Among Ages 20 to 24 years Correlation Summary
| Measurement | Czech | Venezuelan |
| Minimum | 2.6% | 1.2% |
| Maximum | 59.4% | 17.0% |
| Range | 56.8% | 15.8% |
| Mean | 14.4% | 8.6% |
| Median | 9.8% | 9.3% |
| Interquartile 25% (IQ1) | 7.5% | 6.3% |
| Interquartile 75% (IQ3) | 18.2% | 10.3% |
| Interquartile Range (IQR) | 10.7% | 4.0% |
| Standard Deviation (Sample) | 10.9% | 3.5% |
| Standard Deviation (Population) | 10.8% | 3.5% |
Demographics Similar to Czechs and Venezuelans by Unemployment Among Ages 20 to 24 years
In terms of unemployment among ages 20 to 24 years, the demographic groups most similar to Czechs are Chinese (9.4%, a difference of 0.44%), Danish (9.3%, a difference of 0.51%), Hmong (9.4%, a difference of 0.56%), Osage (9.4%, a difference of 0.57%), and Immigrants from Sudan (9.3%, a difference of 0.67%). Similarly, the demographic groups most similar to Venezuelans are Indonesian (9.0%, a difference of 0.21%), Norwegian (9.0%, a difference of 0.22%), Immigrants from Burma/Myanmar (9.1%, a difference of 0.82%), Luxembourger (9.1%, a difference of 1.2%), and Somali (9.1%, a difference of 1.2%).
| Demographics | Rating | Rank | Unemployment Among Ages 20 to 24 years |
| Immigrants | Cuba | 100.0 /100 | #1 | Exceptional 8.7% |
| Immigrants | Venezuela | 100.0 /100 | #2 | Exceptional 8.9% |
| Indonesians | 100.0 /100 | #3 | Exceptional 9.0% |
| Venezuelans | 100.0 /100 | #4 | Exceptional 9.0% |
| Norwegians | 100.0 /100 | #5 | Exceptional 9.0% |
| Immigrants | Burma/Myanmar | 100.0 /100 | #6 | Exceptional 9.1% |
| Luxembourgers | 100.0 /100 | #7 | Exceptional 9.1% |
| Somalis | 100.0 /100 | #8 | Exceptional 9.1% |
| Immigrants | Somalia | 100.0 /100 | #9 | Exceptional 9.2% |
| Sudanese | 100.0 /100 | #10 | Exceptional 9.2% |
| Zimbabweans | 100.0 /100 | #11 | Exceptional 9.2% |
| Cubans | 100.0 /100 | #12 | Exceptional 9.2% |
| Immigrants | Congo | 100.0 /100 | #13 | Exceptional 9.2% |
| Slovenes | 100.0 /100 | #14 | Exceptional 9.3% |
| Immigrants | Sudan | 100.0 /100 | #15 | Exceptional 9.3% |
| Danes | 100.0 /100 | #16 | Exceptional 9.3% |
| Czechs | 100.0 /100 | #17 | Exceptional 9.3% |
| Chinese | 100.0 /100 | #18 | Exceptional 9.4% |
| Hmong | 100.0 /100 | #19 | Exceptional 9.4% |
| Osage | 100.0 /100 | #20 | Exceptional 9.4% |