Czech vs Immigrants from Eastern Africa Unemployment Among Women with Children Ages 6 to 17 years
COMPARE
Czech
Immigrants from Eastern Africa
Unemployment Among Women with Children Ages 6 to 17 years
Unemployment Among Women with Children Ages 6 to 17 years Comparison
Czechs
Immigrants from Eastern Africa
8.7%
UNEMPLOYMENT AMONG WOMEN WITH CHILDREN AGES 6 TO 17 YEARS
94.4/ 100
METRIC RATING
127th/ 347
METRIC RANK
8.9%
UNEMPLOYMENT AMONG WOMEN WITH CHILDREN AGES 6 TO 17 YEARS
74.6/ 100
METRIC RATING
151st/ 347
METRIC RANK
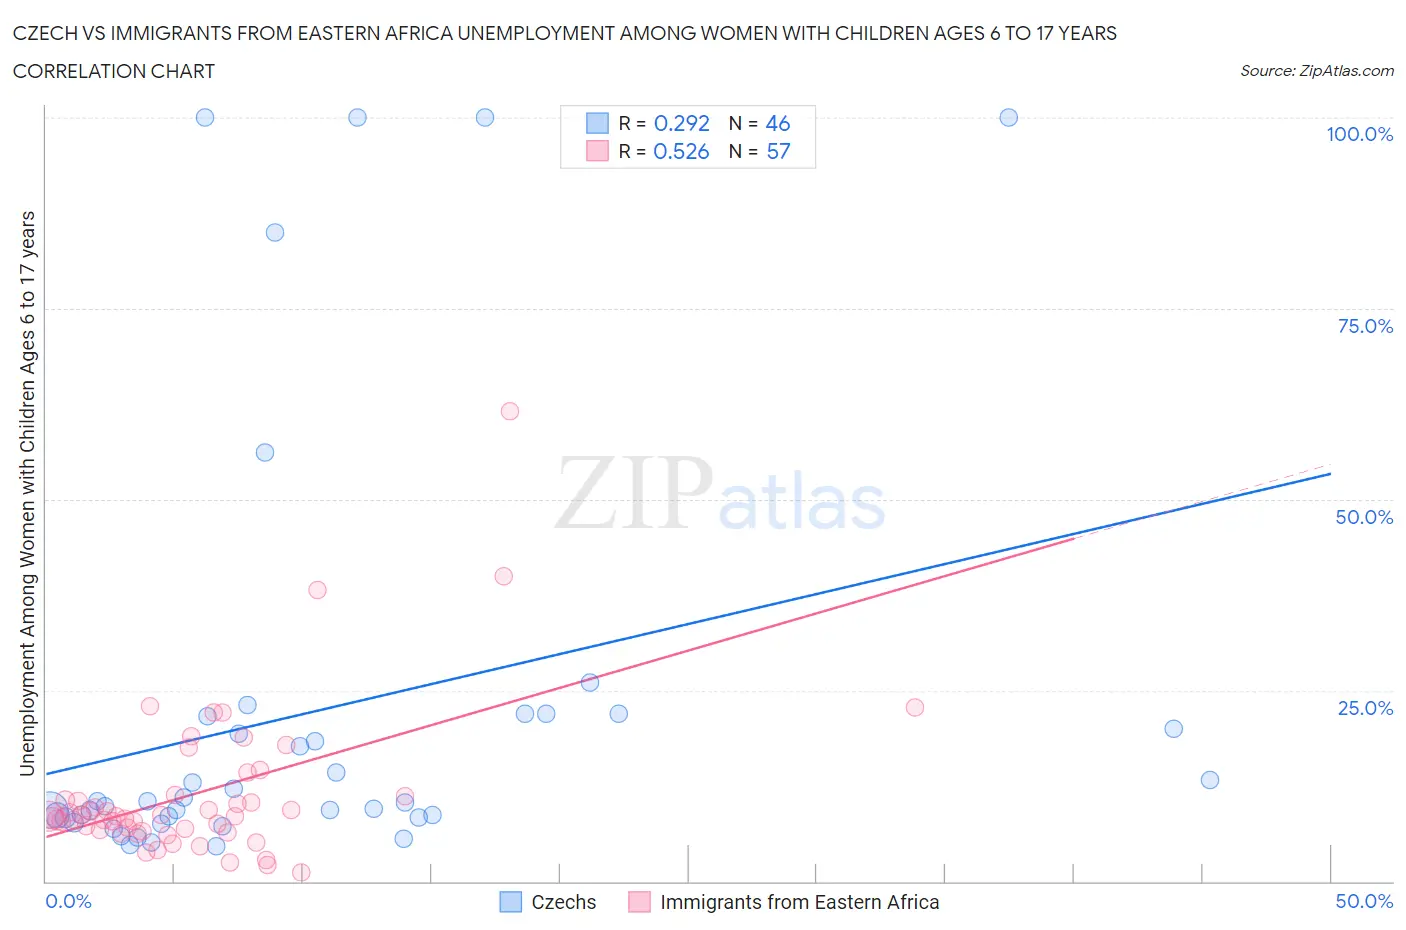
Czech vs Immigrants from Eastern Africa Unemployment Among Women with Children Ages 6 to 17 years Correlation Chart
The statistical analysis conducted on geographies consisting of 319,576,456 people shows a weak positive correlation between the proportion of Czechs and unemployment rate among women with children between the ages 6 and 17 in the United States with a correlation coefficient (R) of 0.292 and weighted average of 8.7%. Similarly, the statistical analysis conducted on geographies consisting of 266,287,330 people shows a substantial positive correlation between the proportion of Immigrants from Eastern Africa and unemployment rate among women with children between the ages 6 and 17 in the United States with a correlation coefficient (R) of 0.526 and weighted average of 8.9%, a difference of 2.0%.
Unemployment Among Women with Children Ages 6 to 17 years Correlation Summary
| Measurement | Czech | Immigrants from Eastern Africa |
| Minimum | 4.6% | 1.1% |
| Maximum | 100.0% | 61.5% |
| Range | 95.4% | 60.4% |
| Mean | 22.1% | 11.5% |
| Median | 10.4% | 8.6% |
| Interquartile 25% (IQ1) | 8.3% | 6.7% |
| Interquartile 75% (IQ3) | 21.6% | 11.2% |
| Interquartile Range (IQR) | 13.3% | 4.6% |
| Standard Deviation (Sample) | 27.9% | 10.1% |
| Standard Deviation (Population) | 27.6% | 10.0% |
Similar Demographics by Unemployment Among Women with Children Ages 6 to 17 years
Demographics Similar to Czechs by Unemployment Among Women with Children Ages 6 to 17 years
In terms of unemployment among women with children ages 6 to 17 years, the demographic groups most similar to Czechs are Immigrants from Northern Africa (8.7%, a difference of 0.010%), Hmong (8.7%, a difference of 0.020%), South African (8.7%, a difference of 0.030%), Immigrants from Morocco (8.7%, a difference of 0.10%), and Immigrants from Lebanon (8.7%, a difference of 0.10%).
| Demographics | Rating | Rank | Unemployment Among Women with Children Ages 6 to 17 years |
| Israelis | 95.9 /100 | #120 | Exceptional 8.7% |
| Immigrants | Denmark | 95.5 /100 | #121 | Exceptional 8.7% |
| Immigrants | Egypt | 95.0 /100 | #122 | Exceptional 8.7% |
| Immigrants | Morocco | 94.9 /100 | #123 | Exceptional 8.7% |
| Immigrants | Lebanon | 94.9 /100 | #124 | Exceptional 8.7% |
| South Africans | 94.6 /100 | #125 | Exceptional 8.7% |
| Immigrants | Northern Africa | 94.4 /100 | #126 | Exceptional 8.7% |
| Czechs | 94.4 /100 | #127 | Exceptional 8.7% |
| Hmong | 94.3 /100 | #128 | Exceptional 8.7% |
| Barbadians | 93.8 /100 | #129 | Exceptional 8.7% |
| Immigrants | Western Asia | 93.1 /100 | #130 | Exceptional 8.7% |
| Slavs | 92.2 /100 | #131 | Exceptional 8.7% |
| Yaqui | 92.2 /100 | #132 | Exceptional 8.7% |
| Egyptians | 91.8 /100 | #133 | Exceptional 8.7% |
| Immigrants | Ireland | 91.0 /100 | #134 | Exceptional 8.7% |
Demographics Similar to Immigrants from Eastern Africa by Unemployment Among Women with Children Ages 6 to 17 years
In terms of unemployment among women with children ages 6 to 17 years, the demographic groups most similar to Immigrants from Eastern Africa are Immigrants from Northern Europe (8.9%, a difference of 0.0%), Greek (8.9%, a difference of 0.040%), Immigrants from Europe (8.9%, a difference of 0.070%), Croatian (8.8%, a difference of 0.090%), and Vietnamese (8.9%, a difference of 0.14%).
| Demographics | Rating | Rank | Unemployment Among Women with Children Ages 6 to 17 years |
| Russians | 85.8 /100 | #144 | Excellent 8.8% |
| Kenyans | 85.6 /100 | #145 | Excellent 8.8% |
| Chileans | 80.8 /100 | #146 | Excellent 8.8% |
| Immigrants | Bangladesh | 79.4 /100 | #147 | Good 8.8% |
| Costa Ricans | 77.0 /100 | #148 | Good 8.8% |
| Croatians | 76.0 /100 | #149 | Good 8.8% |
| Greeks | 75.2 /100 | #150 | Good 8.9% |
| Immigrants | Eastern Africa | 74.6 /100 | #151 | Good 8.9% |
| Immigrants | Northern Europe | 74.6 /100 | #152 | Good 8.9% |
| Immigrants | Europe | 73.4 /100 | #153 | Good 8.9% |
| Vietnamese | 72.1 /100 | #154 | Good 8.9% |
| Immigrants | Greece | 71.8 /100 | #155 | Good 8.9% |
| Osage | 65.9 /100 | #156 | Good 8.9% |
| Immigrants | Belgium | 65.6 /100 | #157 | Good 8.9% |
| Immigrants | Chile | 65.3 /100 | #158 | Good 8.9% |