Czech vs Immigrants from Belgium Unemployment Among Ages 35 to 44 years

COMPARE

Czech
Race
Ancestry
AfghanAfricanAlaska NativeAlaskan AthabascanAlbanianAleutAlsatianAmericanApacheArabArapahoArgentineanArmenianAssyrian/Chaldean/SyriacAustralianAustrianBahamianBangladeshiBarbadianBasqueBelgianBelizeanBermudanBhutaneseBlackfeetBolivianBrazilianBritishBritish West IndianBulgarianBurmeseCajunCambodianCanadianCape VerdeanCarpatho RusynCelticCentral AmericanCentral American IndianCherokeeCheyenneChickasawChileanChineseChippewaChoctawColombianColvilleComancheCosta RicanCreeCreekCroatianCrowCubanCypriotCzechCzechoslovakianDanishDelawareDominicanDutchDutch West IndianEastern EuropeanEcuadorianEgyptianEnglishEstonianEthiopianEuropeanFijianFilipinoFinnishFrenchFrench American IndianFrench CanadianGermanGerman RussianGhanaianGreekGuamanian/ChamorroGuatemalanGuyaneseHaitianHmongHonduranHopiHoumaHungarianIcelanderIndian (Asian)IndonesianInupiatIranianIraqiIrishIroquoisIsraeliItalianJamaicanJapaneseJordanianKenyanKiowaKoreanLaotianLatvianLebaneseLiberianLithuanianLumbeeLuxembourgerMacedonianMalaysianMalteseMarshalleseMenomineeMexicanMexican American IndianMongolianMoroccanNative HawaiianNavajoNepaleseNew ZealanderNicaraguanNigerianNorthern EuropeanNorwegianOkinawanOsageOttawaPaiutePakistaniPalestinianPanamanianParaguayanPennsylvania GermanPeruvianPimaPolishPortuguesePotawatomiPuebloPuerto RicanPuget Sound SalishRomanianRussianSalvadoranSamoanScandinavianScotch-IrishScottishSeminoleSenegaleseSerbianShoshoneSierra LeoneanSiouxSlavicSlovakSloveneSomaliSouth AfricanSouth AmericanSouth American IndianSoviet UnionSpaniardSpanishSpanish AmericanSpanish American IndianSri LankanSubsaharan AfricanSudaneseSwedishSwissSyrianTaiwaneseThaiTlingit-HaidaTohono O'OdhamTonganTrinidadian and TobagonianTsimshianTurkishU.S. Virgin IslanderUgandanUkrainianUruguayanUteVenezuelanVietnameseWelshWest IndianYakamaYaquiYugoslavianYumanYup'ikZimbabwean
Immigration
NonimmigrantsImmigrantsAfghanistanAfricaAlbaniaArgentinaArmeniaAsiaAustraliaAustriaBahamasBangladeshBarbadosBelarusBelizeBoliviaBosnia and HerzegovinaBrazilBulgariaBurma/MyanmarCabo VerdeCambodiaCameroonCanadaCaribbeanCentral AmericaChileChinaColombiaCongoCosta RicaCroatiaCubaCzechoslovakiaDenmarkDominicaDominican RepublicEastern AfricaEastern AsiaEastern EuropeEcuadorEgyptEl SalvadorEnglandEritreaEthiopiaEuropeFijiFranceGermanyGhanaGreeceGrenadaGuatemalaGuyanaHaitiHondurasHong KongHungaryIndiaIndonesiaIranIraqIrelandIsraelItalyJamaicaJapanJordanKazakhstanKenyaKoreaKuwaitLaosLatin AmericaLatviaLebanonLiberiaLithuaniaMalaysiaMexicoMicronesiaMiddle AfricaMoldovaMoroccoNepalNetherlandsNicaraguaNigeriaNorth AmericaNorth MacedoniaNorthern AfricaNorthern EuropeNorwayOceaniaPakistanPanamaPeruPhilippinesPolandPortugalRomaniaRussiaSaudi ArabiaScotlandSenegalSerbiaSierra LeoneSingaporeSomaliaSouth AfricaSouth AmericaSouth Central AsiaSouth Eastern AsiaSouthern EuropeSpainSri LankaSt. Vincent and the GrenadinesSudanSwedenSwitzerlandSyriaTaiwanThailandTrinidad and TobagoTurkeyUgandaUkraineUruguayUzbekistanVenezuelaVietnamWest IndiesWestern AfricaWestern AsiaWestern EuropeYemenZaireZimbabweAzores
Immigrants from Belgium
Race
Ancestry
AfghanAfricanAlaska NativeAlaskan AthabascanAlbanianAleutAlsatianAmericanApacheArabArapahoArgentineanArmenianAssyrian/Chaldean/SyriacAustralianAustrianBahamianBangladeshiBarbadianBasqueBelgianBelizeanBermudanBhutaneseBlackfeetBolivianBrazilianBritishBritish West IndianBulgarianBurmeseCajunCambodianCanadianCape VerdeanCarpatho RusynCelticCentral AmericanCentral American IndianCherokeeCheyenneChickasawChileanChineseChippewaChoctawColombianColvilleComancheCosta RicanCreeCreekCroatianCrowCubanCypriotCzechoslovakianDanishDelawareDominicanDutchDutch West IndianEastern EuropeanEcuadorianEgyptianEnglishEstonianEthiopianEuropeanFijianFilipinoFinnishFrenchFrench American IndianFrench CanadianGermanGerman RussianGhanaianGreekGuamanian/ChamorroGuatemalanGuyaneseHaitianHmongHonduranHopiHoumaHungarianIcelanderIndian (Asian)IndonesianInupiatIranianIraqiIrishIroquoisIsraeliItalianJamaicanJapaneseJordanianKenyanKiowaKoreanLaotianLatvianLebaneseLiberianLithuanianLumbeeLuxembourgerMacedonianMalaysianMalteseMarshalleseMenomineeMexicanMexican American IndianMongolianMoroccanNative HawaiianNavajoNepaleseNew ZealanderNicaraguanNigerianNorthern EuropeanNorwegianOkinawanOsageOttawaPaiutePakistaniPalestinianPanamanianParaguayanPennsylvania GermanPeruvianPimaPolishPortuguesePotawatomiPuebloPuerto RicanPuget Sound SalishRomanianRussianSalvadoranSamoanScandinavianScotch-IrishScottishSeminoleSenegaleseSerbianShoshoneSierra LeoneanSiouxSlavicSlovakSloveneSomaliSouth AfricanSouth AmericanSouth American IndianSoviet UnionSpaniardSpanishSpanish AmericanSpanish American IndianSri LankanSubsaharan AfricanSudaneseSwedishSwissSyrianTaiwaneseThaiTlingit-HaidaTohono O'OdhamTonganTrinidadian and TobagonianTsimshianTurkishU.S. Virgin IslanderUgandanUkrainianUruguayanUteVenezuelanVietnameseWelshWest IndianYakamaYaquiYugoslavianYumanYup'ikZimbabwean
Immigration
NonimmigrantsImmigrantsAfghanistanAfricaAlbaniaArgentinaArmeniaAsiaAustraliaAustriaBahamasBangladeshBarbadosBelarusBelgiumBelizeBoliviaBosnia and HerzegovinaBrazilBulgariaBurma/MyanmarCabo VerdeCambodiaCameroonCanadaCaribbeanCentral AmericaChileChinaColombiaCongoCosta RicaCroatiaCubaCzechoslovakiaDenmarkDominicaDominican RepublicEastern AfricaEastern AsiaEastern EuropeEcuadorEgyptEl SalvadorEnglandEritreaEthiopiaEuropeFijiFranceGermanyGhanaGreeceGrenadaGuatemalaGuyanaHaitiHondurasHong KongHungaryIndiaIndonesiaIranIraqIrelandIsraelItalyJamaicaJapanJordanKazakhstanKenyaKoreaKuwaitLaosLatin AmericaLatviaLebanonLiberiaLithuaniaMalaysiaMexicoMicronesiaMiddle AfricaMoldovaMoroccoNepalNetherlandsNicaraguaNigeriaNorth AmericaNorth MacedoniaNorthern AfricaNorthern EuropeNorwayOceaniaPakistanPanamaPeruPhilippinesPolandPortugalRomaniaRussiaSaudi ArabiaScotlandSenegalSerbiaSierra LeoneSingaporeSomaliaSouth AfricaSouth AmericaSouth Central AsiaSouth Eastern AsiaSouthern EuropeSpainSri LankaSt. Vincent and the GrenadinesSudanSwedenSwitzerlandSyriaTaiwanThailandTrinidad and TobagoTurkeyUgandaUkraineUruguayUzbekistanVenezuelaVietnamWest IndiesWestern AfricaWestern AsiaWestern EuropeYemenZaireZimbabweAzores
Unemployment Among Ages 35 to 44 years
Income
Poverty
Unemployment
Labor Participation
Family Structure
Vehicle Availability
Education Level
Disability

Unemployment Among Ages 35 to 44 years Comparison

Czechs

Immigrants from Belgium

Exceptional
Exceptional
4.1%
UNEMPLOYMENT AMONG AGES 35 TO 44 YEARS
99.9/ 100
METRIC RATING
14th/ 347
METRIC RANK
4.3%
UNEMPLOYMENT AMONG AGES 35 TO 44 YEARS
98.4/ 100
METRIC RATING
46th/ 347
METRIC RANK

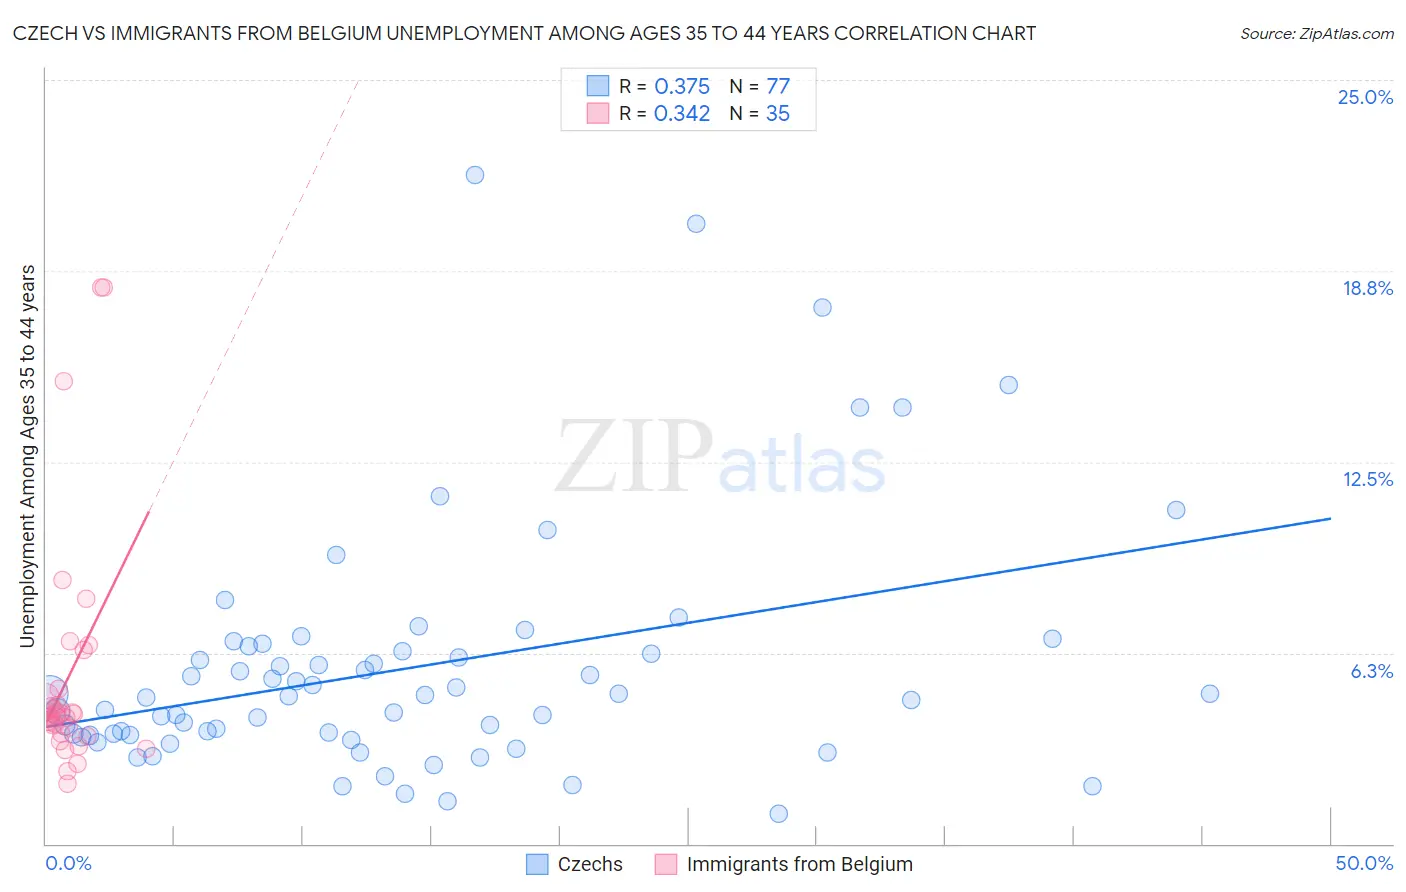
Czech vs Immigrants from Belgium Unemployment Among Ages 35 to 44 years Correlation Chart

The statistical analysis conducted on geographies consisting of 462,421,231 people shows a mild positive correlation between the proportion of Czechs and unemployment rate among population between the ages 35 and 44 in the United States with a correlation coefficient (R) of 0.375 and weighted average of 4.1%. Similarly, the statistical analysis conducted on geographies consisting of 145,364,037 people shows a mild positive correlation between the proportion of Immigrants from Belgium and unemployment rate among population between the ages 35 and 44 in the United States with a correlation coefficient (R) of 0.342 and weighted average of 4.3%, a difference of 4.8%.
Czech vs Immigrants from Belgium Unemployment Among Ages 35 to 44 years

Unemployment Among Ages 35 to 44 years Correlation Summary

MeasurementCzechImmigrants from Belgium
Minimum1.0%2.0%
Maximum21.9%18.2%
Range20.9%16.2%
Mean5.8%5.5%
Median4.8%4.2%
Interquartile 25% (IQ1)3.6%3.6%
Interquartile 75% (IQ3)6.4%5.1%
Interquartile Range (IQR)2.8%1.5%
Standard Deviation (Sample)4.0%3.9%
Standard Deviation (Population)4.0%3.9%

Similar Demographics by Unemployment Among Ages 35 to 44 years

Demographics Similar to Czechs by Unemployment Among Ages 35 to 44 years

In terms of unemployment among ages 35 to 44 years, the demographic groups most similar to Czechs are Tongan (4.2%, a difference of 0.080%), Bolivian (4.1%, a difference of 0.10%), Venezuelan (4.1%, a difference of 0.14%), Sudanese (4.1%, a difference of 0.24%), and Immigrants from Singapore (4.1%, a difference of 0.31%).
DemographicsRating | RankUnemployment Among Ages 35 to 44 years
Immigrants | Cuba
99.9
/100
|
#7
Exceptional
4.1%
Immigrants | South Central Asia
99.9
/100
|
#8
Exceptional
4.1%
Danes
99.9
/100
|
#9
Exceptional
4.1%
Immigrants | Singapore
99.9
/100
|
#10
Exceptional
4.1%
Sudanese
99.9
/100
|
#11
Exceptional
4.1%
Venezuelans
99.9
/100
|
#12
Exceptional
4.1%
Bolivians
99.9
/100
|
#13
Exceptional
4.1%
Czechs
99.9
/100
|
#14
Exceptional
4.1%
Tongans
99.8
/100
|
#15
Exceptional
4.2%
Cubans
99.8
/100
|
#16
Exceptional
4.2%
Swedes
99.8
/100
|
#17
Exceptional
4.2%
Latvians
99.8
/100
|
#18
Exceptional
4.2%
Immigrants | Nepal
99.7
/100
|
#19
Exceptional
4.2%
Immigrants | Bolivia
99.7
/100
|
#20
Exceptional
4.2%
Paraguayans
99.6
/100
|
#21
Exceptional
4.2%

Demographics Similar to Immigrants from Belgium by Unemployment Among Ages 35 to 44 years

In terms of unemployment among ages 35 to 44 years, the demographic groups most similar to Immigrants from Belgium are Immigrants from Korea (4.3%, a difference of 0.010%), British (4.4%, a difference of 0.15%), Bhutanese (4.4%, a difference of 0.24%), Swiss (4.4%, a difference of 0.24%), and Immigrants from Malaysia (4.3%, a difference of 0.33%).
DemographicsRating | RankUnemployment Among Ages 35 to 44 years
Palestinians
98.8
/100
|
#39
Exceptional
4.3%
Zimbabweans
98.8
/100
|
#40
Exceptional
4.3%
Belgians
98.7
/100
|
#41
Exceptional
4.3%
Germans
98.7
/100
|
#42
Exceptional
4.3%
Eastern Europeans
98.7
/100
|
#43
Exceptional
4.3%
Immigrants | Malaysia
98.7
/100
|
#44
Exceptional
4.3%
Immigrants | Korea
98.4
/100
|
#45
Exceptional
4.3%
Immigrants | Belgium
98.4
/100
|
#46
Exceptional
4.3%
British
98.3
/100
|
#47
Exceptional
4.4%
Bhutanese
98.2
/100
|
#48
Exceptional
4.4%
Swiss
98.2
/100
|
#49
Exceptional
4.4%
Immigrants | Turkey
97.8
/100
|
#50
Exceptional
4.4%
Immigrants | Eastern Asia
97.8
/100
|
#51
Exceptional
4.4%
Okinawans
97.7
/100
|
#52
Exceptional
4.4%
Immigrants | Argentina
97.6
/100
|
#53
Exceptional
4.4%