Czechoslovakian vs Seminole Unemployment Among Ages 35 to 44 years

COMPARE

Czechoslovakian
Race
Ancestry
AfghanAfricanAlaska NativeAlaskan AthabascanAlbanianAleutAlsatianAmericanApacheArabArapahoArgentineanArmenianAssyrian/Chaldean/SyriacAustralianAustrianBahamianBangladeshiBarbadianBasqueBelgianBelizeanBermudanBhutaneseBlackfeetBolivianBrazilianBritishBritish West IndianBulgarianBurmeseCajunCambodianCanadianCape VerdeanCarpatho RusynCelticCentral AmericanCentral American IndianCherokeeCheyenneChickasawChileanChineseChippewaChoctawColombianColvilleComancheCosta RicanCreeCreekCroatianCrowCubanCypriotCzechCzechoslovakianDanishDelawareDominicanDutchDutch West IndianEastern EuropeanEcuadorianEgyptianEnglishEstonianEthiopianEuropeanFijianFilipinoFinnishFrenchFrench American IndianFrench CanadianGermanGerman RussianGhanaianGreekGuamanian/ChamorroGuatemalanGuyaneseHaitianHmongHonduranHopiHoumaHungarianIcelanderIndian (Asian)IndonesianInupiatIranianIraqiIrishIroquoisIsraeliItalianJamaicanJapaneseJordanianKenyanKiowaKoreanLaotianLatvianLebaneseLiberianLithuanianLumbeeLuxembourgerMacedonianMalaysianMalteseMarshalleseMenomineeMexicanMexican American IndianMongolianMoroccanNative HawaiianNavajoNepaleseNew ZealanderNicaraguanNigerianNorthern EuropeanNorwegianOkinawanOsageOttawaPaiutePakistaniPalestinianPanamanianParaguayanPennsylvania GermanPeruvianPimaPolishPortuguesePotawatomiPuebloPuerto RicanPuget Sound SalishRomanianRussianSalvadoranSamoanScandinavianScotch-IrishScottishSenegaleseSerbianShoshoneSierra LeoneanSiouxSlavicSlovakSloveneSomaliSouth AfricanSouth AmericanSouth American IndianSoviet UnionSpaniardSpanishSpanish AmericanSpanish American IndianSri LankanSubsaharan AfricanSudaneseSwedishSwissSyrianTaiwaneseThaiTlingit-HaidaTohono O'OdhamTonganTrinidadian and TobagonianTsimshianTurkishU.S. Virgin IslanderUgandanUkrainianUruguayanUteVenezuelanVietnameseWelshWest IndianYakamaYaquiYugoslavianYumanYup'ikZimbabwean
Immigration
NonimmigrantsImmigrantsAfghanistanAfricaAlbaniaArgentinaArmeniaAsiaAustraliaAustriaBahamasBangladeshBarbadosBelarusBelgiumBelizeBoliviaBosnia and HerzegovinaBrazilBulgariaBurma/MyanmarCabo VerdeCambodiaCameroonCanadaCaribbeanCentral AmericaChileChinaColombiaCongoCosta RicaCroatiaCubaCzechoslovakiaDenmarkDominicaDominican RepublicEastern AfricaEastern AsiaEastern EuropeEcuadorEgyptEl SalvadorEnglandEritreaEthiopiaEuropeFijiFranceGermanyGhanaGreeceGrenadaGuatemalaGuyanaHaitiHondurasHong KongHungaryIndiaIndonesiaIranIraqIrelandIsraelItalyJamaicaJapanJordanKazakhstanKenyaKoreaKuwaitLaosLatin AmericaLatviaLebanonLiberiaLithuaniaMalaysiaMexicoMicronesiaMiddle AfricaMoldovaMoroccoNepalNetherlandsNicaraguaNigeriaNorth AmericaNorth MacedoniaNorthern AfricaNorthern EuropeNorwayOceaniaPakistanPanamaPeruPhilippinesPolandPortugalRomaniaRussiaSaudi ArabiaScotlandSenegalSerbiaSierra LeoneSingaporeSomaliaSouth AfricaSouth AmericaSouth Central AsiaSouth Eastern AsiaSouthern EuropeSpainSri LankaSt. Vincent and the GrenadinesSudanSwedenSwitzerlandSyriaTaiwanThailandTrinidad and TobagoTurkeyUgandaUkraineUruguayUzbekistanVenezuelaVietnamWest IndiesWestern AfricaWestern AsiaWestern EuropeYemenZaireZimbabweAzores
Seminole
Race
Ancestry
AfghanAfricanAlaska NativeAlaskan AthabascanAlbanianAleutAlsatianAmericanApacheArabArapahoArgentineanArmenianAssyrian/Chaldean/SyriacAustralianAustrianBahamianBangladeshiBarbadianBasqueBelgianBelizeanBermudanBhutaneseBlackfeetBolivianBrazilianBritishBritish West IndianBulgarianBurmeseCajunCambodianCanadianCape VerdeanCarpatho RusynCelticCentral AmericanCentral American IndianCherokeeCheyenneChickasawChileanChineseChippewaChoctawColombianColvilleComancheCosta RicanCreeCreekCroatianCrowCubanCypriotCzechDanishDelawareDominicanDutchDutch West IndianEastern EuropeanEcuadorianEgyptianEnglishEstonianEthiopianEuropeanFijianFilipinoFinnishFrenchFrench American IndianFrench CanadianGermanGerman RussianGhanaianGreekGuamanian/ChamorroGuatemalanGuyaneseHaitianHmongHonduranHopiHoumaHungarianIcelanderIndian (Asian)IndonesianInupiatIranianIraqiIrishIroquoisIsraeliItalianJamaicanJapaneseJordanianKenyanKiowaKoreanLaotianLatvianLebaneseLiberianLithuanianLumbeeLuxembourgerMacedonianMalaysianMalteseMarshalleseMenomineeMexicanMexican American IndianMongolianMoroccanNative HawaiianNavajoNepaleseNew ZealanderNicaraguanNigerianNorthern EuropeanNorwegianOkinawanOsageOttawaPaiutePakistaniPalestinianPanamanianParaguayanPennsylvania GermanPeruvianPimaPolishPortuguesePotawatomiPuebloPuerto RicanPuget Sound SalishRomanianRussianSalvadoranSamoanScandinavianScotch-IrishScottishSeminoleSenegaleseSerbianShoshoneSierra LeoneanSiouxSlavicSlovakSloveneSomaliSouth AfricanSouth AmericanSouth American IndianSoviet UnionSpaniardSpanishSpanish AmericanSpanish American IndianSri LankanSubsaharan AfricanSudaneseSwedishSwissSyrianTaiwaneseThaiTlingit-HaidaTohono O'OdhamTonganTrinidadian and TobagonianTsimshianTurkishU.S. Virgin IslanderUgandanUkrainianUruguayanUteVenezuelanVietnameseWelshWest IndianYakamaYaquiYugoslavianYumanYup'ikZimbabwean
Immigration
NonimmigrantsImmigrantsAfghanistanAfricaAlbaniaArgentinaArmeniaAsiaAustraliaAustriaBahamasBangladeshBarbadosBelarusBelgiumBelizeBoliviaBosnia and HerzegovinaBrazilBulgariaBurma/MyanmarCabo VerdeCambodiaCameroonCanadaCaribbeanCentral AmericaChileChinaColombiaCongoCosta RicaCroatiaCubaCzechoslovakiaDenmarkDominicaDominican RepublicEastern AfricaEastern AsiaEastern EuropeEcuadorEgyptEl SalvadorEnglandEritreaEthiopiaEuropeFijiFranceGermanyGhanaGreeceGrenadaGuatemalaGuyanaHaitiHondurasHong KongHungaryIndiaIndonesiaIranIraqIrelandIsraelItalyJamaicaJapanJordanKazakhstanKenyaKoreaKuwaitLaosLatin AmericaLatviaLebanonLiberiaLithuaniaMalaysiaMexicoMicronesiaMiddle AfricaMoldovaMoroccoNepalNetherlandsNicaraguaNigeriaNorth AmericaNorth MacedoniaNorthern AfricaNorthern EuropeNorwayOceaniaPakistanPanamaPeruPhilippinesPolandPortugalRomaniaRussiaSaudi ArabiaScotlandSenegalSerbiaSierra LeoneSingaporeSomaliaSouth AfricaSouth AmericaSouth Central AsiaSouth Eastern AsiaSouthern EuropeSpainSri LankaSt. Vincent and the GrenadinesSudanSwedenSwitzerlandSyriaTaiwanThailandTrinidad and TobagoTurkeyUgandaUkraineUruguayUzbekistanVenezuelaVietnamWest IndiesWestern AfricaWestern AsiaWestern EuropeYemenZaireZimbabweAzores
Unemployment Among Ages 35 to 44 years
Income
Poverty
Unemployment
Labor Participation
Family Structure
Vehicle Availability
Education Level
Disability

Unemployment Among Ages 35 to 44 years Comparison

Czechoslovakians

Seminole

Excellent
Tragic
4.6%
UNEMPLOYMENT AMONG AGES 35 TO 44 YEARS
83.4/ 100
METRIC RATING
128th/ 347
METRIC RANK
5.2%
UNEMPLOYMENT AMONG AGES 35 TO 44 YEARS
0.1/ 100
METRIC RATING
256th/ 347
METRIC RANK

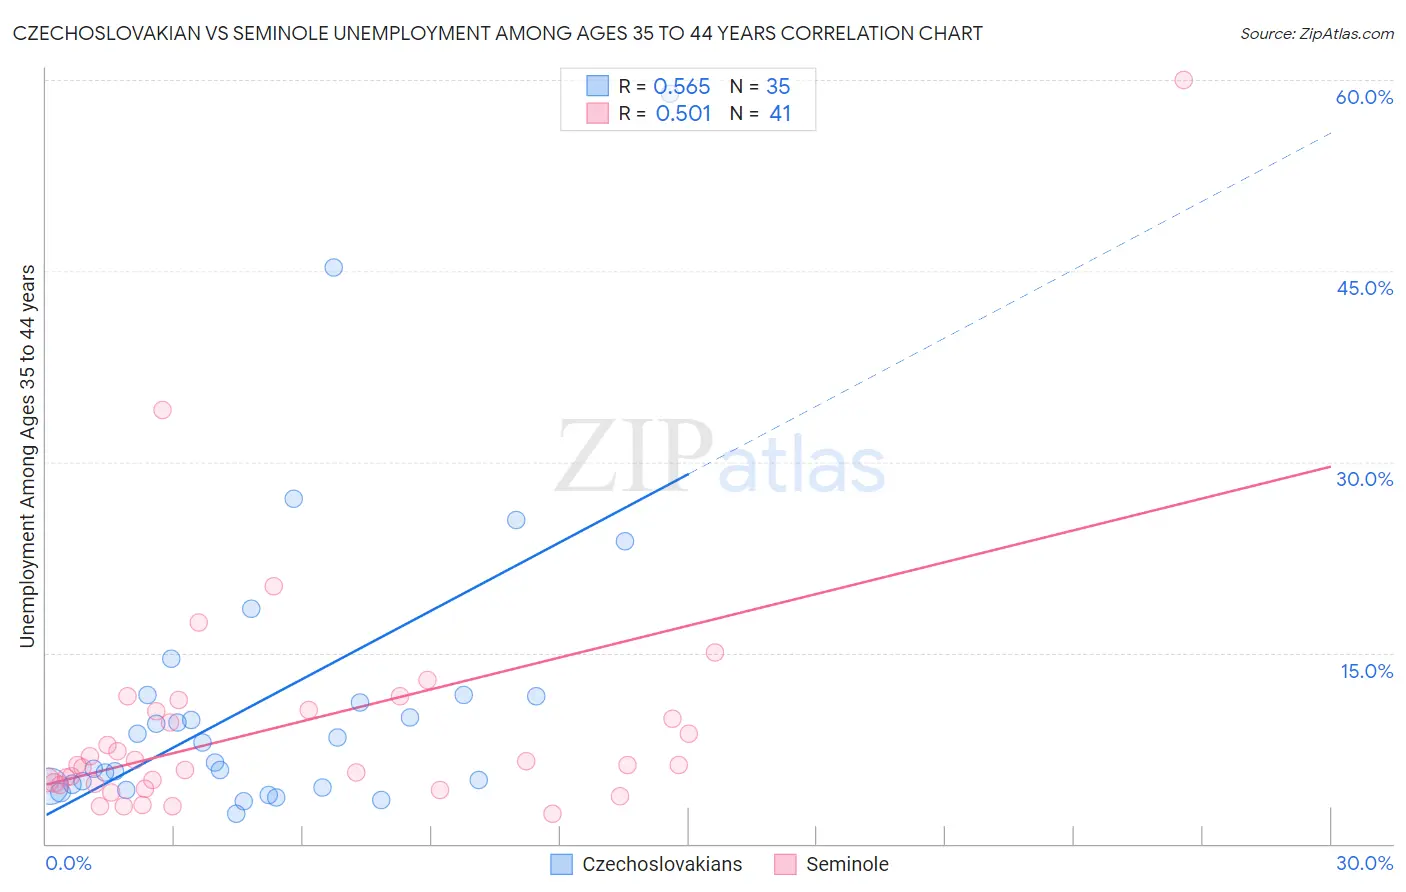
Czechoslovakian vs Seminole Unemployment Among Ages 35 to 44 years Correlation Chart

The statistical analysis conducted on geographies consisting of 358,099,103 people shows a substantial positive correlation between the proportion of Czechoslovakians and unemployment rate among population between the ages 35 and 44 in the United States with a correlation coefficient (R) of 0.565 and weighted average of 4.6%. Similarly, the statistical analysis conducted on geographies consisting of 117,376,449 people shows a substantial positive correlation between the proportion of Seminole and unemployment rate among population between the ages 35 and 44 in the United States with a correlation coefficient (R) of 0.501 and weighted average of 5.2%, a difference of 15.0%.
Czechoslovakian vs Seminole Unemployment Among Ages 35 to 44 years

Unemployment Among Ages 35 to 44 years Correlation Summary

MeasurementCzechoslovakianSeminole
Minimum2.3%2.4%
Maximum59.0%60.0%
Range56.6%57.6%
Mean11.4%9.2%
Median8.0%6.2%
Interquartile 25% (IQ1)4.5%4.7%
Interquartile 75% (IQ3)11.6%10.5%
Interquartile Range (IQR)7.2%5.8%
Standard Deviation (Sample)12.0%10.0%
Standard Deviation (Population)11.9%9.8%

Similar Demographics by Unemployment Among Ages 35 to 44 years

Demographics Similar to Czechoslovakians by Unemployment Among Ages 35 to 44 years

In terms of unemployment among ages 35 to 44 years, the demographic groups most similar to Czechoslovakians are Immigrants from Croatia (4.6%, a difference of 0.040%), Immigrants from Eritrea (4.6%, a difference of 0.080%), Immigrants from Colombia (4.6%, a difference of 0.10%), Immigrants from Ethiopia (4.5%, a difference of 0.17%), and Immigrants from Austria (4.5%, a difference of 0.18%).
DemographicsRating | RankUnemployment Among Ages 35 to 44 years
Immigrants | South Africa
86.8
/100
|
#121
Excellent
4.5%
Sri Lankans
86.8
/100
|
#122
Excellent
4.5%
Basques
86.3
/100
|
#123
Excellent
4.5%
Immigrants | Spain
86.1
/100
|
#124
Excellent
4.5%
Immigrants | Northern Africa
86.1
/100
|
#125
Excellent
4.5%
Immigrants | Austria
84.7
/100
|
#126
Excellent
4.5%
Immigrants | Ethiopia
84.7
/100
|
#127
Excellent
4.5%
Czechoslovakians
83.4
/100
|
#128
Excellent
4.6%
Immigrants | Croatia
83.1
/100
|
#129
Excellent
4.6%
Immigrants | Eritrea
82.8
/100
|
#130
Excellent
4.6%
Immigrants | Colombia
82.6
/100
|
#131
Excellent
4.6%
Colombians
80.8
/100
|
#132
Excellent
4.6%
Syrians
80.7
/100
|
#133
Excellent
4.6%
Laotians
80.1
/100
|
#134
Excellent
4.6%
Immigrants | Europe
79.4
/100
|
#135
Good
4.6%

Demographics Similar to Seminole by Unemployment Among Ages 35 to 44 years

In terms of unemployment among ages 35 to 44 years, the demographic groups most similar to Seminole are Cherokee (5.2%, a difference of 0.25%), Immigrants from Fiji (5.3%, a difference of 0.29%), Immigrants from Bahamas (5.2%, a difference of 0.31%), Mexican American Indian (5.2%, a difference of 0.34%), and Armenian (5.2%, a difference of 0.36%).
DemographicsRating | RankUnemployment Among Ages 35 to 44 years
Immigrants | Liberia
0.2
/100
|
#249
Tragic
5.2%
Immigrants | El Salvador
0.2
/100
|
#250
Tragic
5.2%
Comanche
0.2
/100
|
#251
Tragic
5.2%
Armenians
0.2
/100
|
#252
Tragic
5.2%
Mexican American Indians
0.2
/100
|
#253
Tragic
5.2%
Immigrants | Bahamas
0.2
/100
|
#254
Tragic
5.2%
Cherokee
0.2
/100
|
#255
Tragic
5.2%
Seminole
0.1
/100
|
#256
Tragic
5.2%
Immigrants | Fiji
0.1
/100
|
#257
Tragic
5.3%
Immigrants | Latin America
0.1
/100
|
#258
Tragic
5.3%
Mexicans
0.1
/100
|
#259
Tragic
5.3%
Sub-Saharan Africans
0.1
/100
|
#260
Tragic
5.3%
Spanish Americans
0.1
/100
|
#261
Tragic
5.3%
Immigrants | Central America
0.1
/100
|
#262
Tragic
5.3%
Choctaw
0.1
/100
|
#263
Tragic
5.3%