Czechoslovakian vs Immigrants from Iraq Unemployment Among Ages 60 to 64 years

COMPARE

Czechoslovakian
Race
Ancestry
AfghanAfricanAlaska NativeAlaskan AthabascanAlbanianAleutAlsatianAmericanApacheArabArapahoArgentineanArmenianAssyrian/Chaldean/SyriacAustralianAustrianBahamianBangladeshiBarbadianBasqueBelgianBelizeanBermudanBhutaneseBlackfeetBolivianBrazilianBritishBritish West IndianBulgarianBurmeseCajunCambodianCanadianCape VerdeanCarpatho RusynCelticCentral AmericanCentral American IndianCherokeeCheyenneChickasawChileanChineseChippewaChoctawColombianColvilleComancheCosta RicanCreeCreekCroatianCrowCubanCypriotCzechCzechoslovakianDanishDelawareDominicanDutchDutch West IndianEastern EuropeanEcuadorianEgyptianEnglishEstonianEthiopianEuropeanFijianFilipinoFinnishFrenchFrench American IndianFrench CanadianGermanGerman RussianGhanaianGreekGuamanian/ChamorroGuatemalanGuyaneseHaitianHmongHonduranHopiHoumaHungarianIcelanderIndian (Asian)IndonesianInupiatIranianIraqiIrishIroquoisIsraeliItalianJamaicanJapaneseJordanianKenyanKiowaKoreanLaotianLatvianLebaneseLiberianLithuanianLumbeeLuxembourgerMacedonianMalaysianMalteseMarshalleseMenomineeMexicanMexican American IndianMongolianMoroccanNative HawaiianNavajoNepaleseNew ZealanderNicaraguanNigerianNorthern EuropeanNorwegianOkinawanOsageOttawaPaiutePakistaniPalestinianPanamanianParaguayanPennsylvania GermanPeruvianPimaPolishPortuguesePotawatomiPuebloPuerto RicanPuget Sound SalishRomanianRussianSalvadoranSamoanScandinavianScotch-IrishScottishSeminoleSenegaleseSerbianShoshoneSierra LeoneanSiouxSlavicSlovakSloveneSomaliSouth AfricanSouth AmericanSouth American IndianSoviet UnionSpaniardSpanishSpanish AmericanSpanish American IndianSri LankanSubsaharan AfricanSudaneseSwedishSwissSyrianTaiwaneseThaiTlingit-HaidaTohono O'OdhamTonganTrinidadian and TobagonianTsimshianTurkishU.S. Virgin IslanderUgandanUkrainianUruguayanUteVenezuelanVietnameseWelshWest IndianYakamaYaquiYugoslavianYumanYup'ikZimbabwean
Immigration
NonimmigrantsImmigrantsAfghanistanAfricaAlbaniaArgentinaArmeniaAsiaAustraliaAustriaBahamasBangladeshBarbadosBelarusBelgiumBelizeBoliviaBosnia and HerzegovinaBrazilBulgariaBurma/MyanmarCabo VerdeCambodiaCameroonCanadaCaribbeanCentral AmericaChileChinaColombiaCongoCosta RicaCroatiaCubaCzechoslovakiaDenmarkDominicaDominican RepublicEastern AfricaEastern AsiaEastern EuropeEcuadorEgyptEl SalvadorEnglandEritreaEthiopiaEuropeFijiFranceGermanyGhanaGreeceGrenadaGuatemalaGuyanaHaitiHondurasHong KongHungaryIndiaIndonesiaIranIrelandIsraelItalyJamaicaJapanJordanKazakhstanKenyaKoreaKuwaitLaosLatin AmericaLatviaLebanonLiberiaLithuaniaMalaysiaMexicoMicronesiaMiddle AfricaMoldovaMoroccoNepalNetherlandsNicaraguaNigeriaNorth AmericaNorth MacedoniaNorthern AfricaNorthern EuropeNorwayOceaniaPakistanPanamaPeruPhilippinesPolandPortugalRomaniaRussiaSaudi ArabiaScotlandSenegalSerbiaSierra LeoneSingaporeSomaliaSouth AfricaSouth AmericaSouth Central AsiaSouth Eastern AsiaSouthern EuropeSpainSri LankaSt. Vincent and the GrenadinesSudanSwedenSwitzerlandSyriaTaiwanThailandTrinidad and TobagoTurkeyUgandaUkraineUruguayUzbekistanVenezuelaVietnamWest IndiesWestern AfricaWestern AsiaWestern EuropeYemenZaireZimbabweAzores
Immigrants from Iraq
Race
Ancestry
AfghanAfricanAlaska NativeAlaskan AthabascanAlbanianAleutAlsatianAmericanApacheArabArapahoArgentineanArmenianAssyrian/Chaldean/SyriacAustralianAustrianBahamianBangladeshiBarbadianBasqueBelgianBelizeanBermudanBhutaneseBlackfeetBolivianBrazilianBritishBritish West IndianBulgarianBurmeseCajunCambodianCanadianCape VerdeanCarpatho RusynCelticCentral AmericanCentral American IndianCherokeeCheyenneChickasawChileanChineseChippewaChoctawColombianColvilleComancheCosta RicanCreeCreekCroatianCrowCubanCypriotCzechDanishDelawareDominicanDutchDutch West IndianEastern EuropeanEcuadorianEgyptianEnglishEstonianEthiopianEuropeanFijianFilipinoFinnishFrenchFrench American IndianFrench CanadianGermanGerman RussianGhanaianGreekGuamanian/ChamorroGuatemalanGuyaneseHaitianHmongHonduranHopiHoumaHungarianIcelanderIndian (Asian)IndonesianInupiatIranianIraqiIrishIroquoisIsraeliItalianJamaicanJapaneseJordanianKenyanKiowaKoreanLaotianLatvianLebaneseLiberianLithuanianLumbeeLuxembourgerMacedonianMalaysianMalteseMarshalleseMenomineeMexicanMexican American IndianMongolianMoroccanNative HawaiianNavajoNepaleseNew ZealanderNicaraguanNigerianNorthern EuropeanNorwegianOkinawanOsageOttawaPaiutePakistaniPalestinianPanamanianParaguayanPennsylvania GermanPeruvianPimaPolishPortuguesePotawatomiPuebloPuerto RicanPuget Sound SalishRomanianRussianSalvadoranSamoanScandinavianScotch-IrishScottishSeminoleSenegaleseSerbianShoshoneSierra LeoneanSiouxSlavicSlovakSloveneSomaliSouth AfricanSouth AmericanSouth American IndianSoviet UnionSpaniardSpanishSpanish AmericanSpanish American IndianSri LankanSubsaharan AfricanSudaneseSwedishSwissSyrianTaiwaneseThaiTlingit-HaidaTohono O'OdhamTonganTrinidadian and TobagonianTsimshianTurkishU.S. Virgin IslanderUgandanUkrainianUruguayanUteVenezuelanVietnameseWelshWest IndianYakamaYaquiYugoslavianYumanYup'ikZimbabwean
Immigration
NonimmigrantsImmigrantsAfghanistanAfricaAlbaniaArgentinaArmeniaAsiaAustraliaAustriaBahamasBangladeshBarbadosBelarusBelgiumBelizeBoliviaBosnia and HerzegovinaBrazilBulgariaBurma/MyanmarCabo VerdeCambodiaCameroonCanadaCaribbeanCentral AmericaChileChinaColombiaCongoCosta RicaCroatiaCubaCzechoslovakiaDenmarkDominicaDominican RepublicEastern AfricaEastern AsiaEastern EuropeEcuadorEgyptEl SalvadorEnglandEritreaEthiopiaEuropeFijiFranceGermanyGhanaGreeceGrenadaGuatemalaGuyanaHaitiHondurasHong KongHungaryIndiaIndonesiaIranIraqIrelandIsraelItalyJamaicaJapanJordanKazakhstanKenyaKoreaKuwaitLaosLatin AmericaLatviaLebanonLiberiaLithuaniaMalaysiaMexicoMicronesiaMiddle AfricaMoldovaMoroccoNepalNetherlandsNicaraguaNigeriaNorth AmericaNorth MacedoniaNorthern AfricaNorthern EuropeNorwayOceaniaPakistanPanamaPeruPhilippinesPolandPortugalRomaniaRussiaSaudi ArabiaScotlandSenegalSerbiaSierra LeoneSingaporeSomaliaSouth AfricaSouth AmericaSouth Central AsiaSouth Eastern AsiaSouthern EuropeSpainSri LankaSt. Vincent and the GrenadinesSudanSwedenSwitzerlandSyriaTaiwanThailandTrinidad and TobagoTurkeyUgandaUkraineUruguayUzbekistanVenezuelaVietnamWest IndiesWestern AfricaWestern AsiaWestern EuropeYemenZaireZimbabweAzores
Unemployment Among Ages 60 to 64 years
Income
Poverty
Unemployment
Labor Participation
Family Structure
Vehicle Availability
Education Level
Disability

Unemployment Among Ages 60 to 64 years Comparison

Czechoslovakians

Immigrants from Iraq

Exceptional
Exceptional
4.6%
UNEMPLOYMENT AMONG AGES 60 TO 64 YEARS
99.7/ 100
METRIC RATING
63rd/ 347
METRIC RANK
4.5%
UNEMPLOYMENT AMONG AGES 60 TO 64 YEARS
100.0/ 100
METRIC RATING
27th/ 347
METRIC RANK

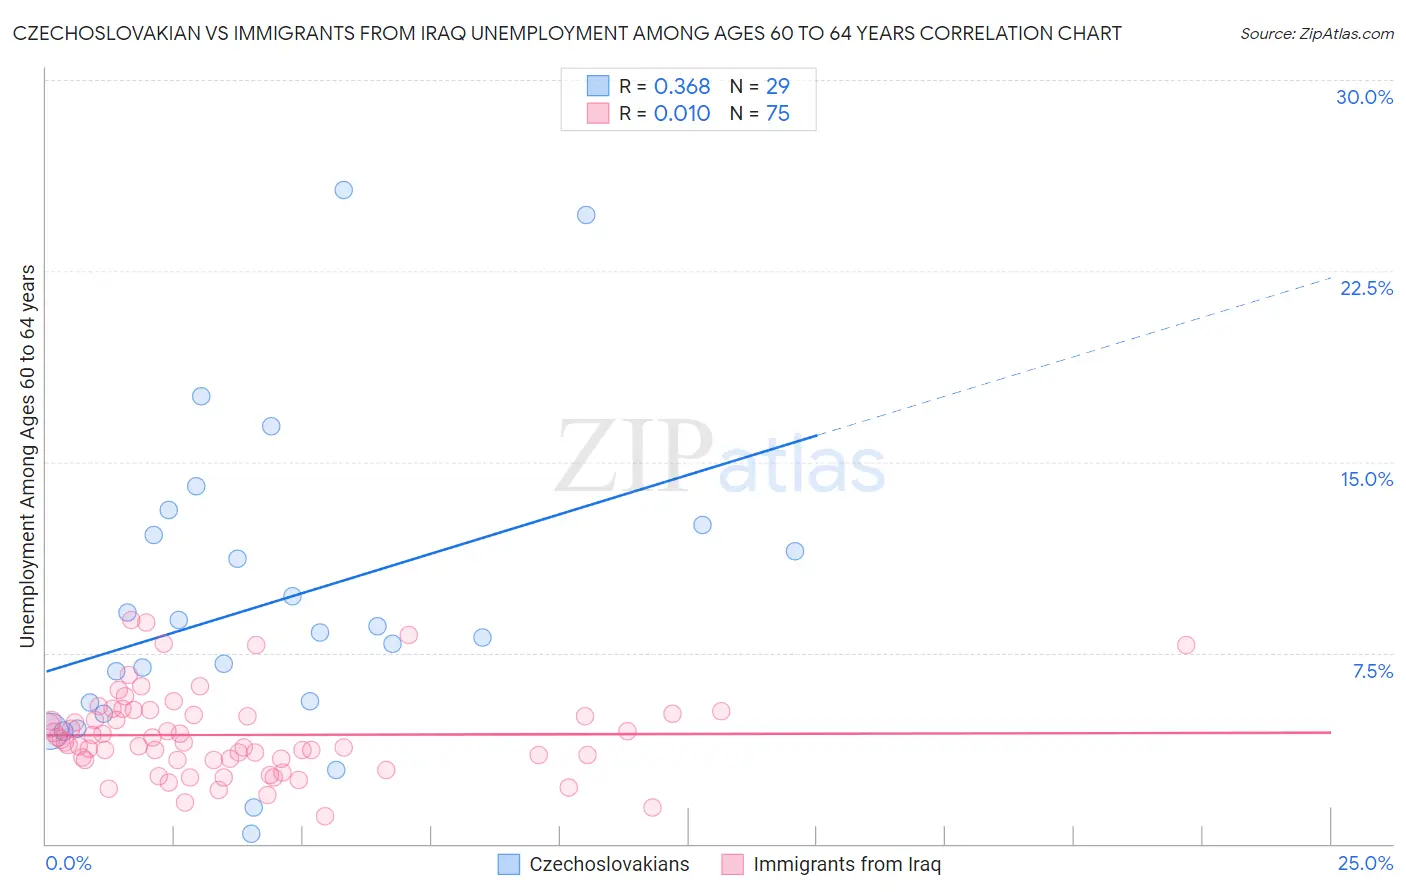
Czechoslovakian vs Immigrants from Iraq Unemployment Among Ages 60 to 64 years Correlation Chart

The statistical analysis conducted on geographies consisting of 329,606,514 people shows a mild positive correlation between the proportion of Czechoslovakians and unemployment rate among population between the ages 60 and 64 in the United States with a correlation coefficient (R) of 0.368 and weighted average of 4.6%. Similarly, the statistical analysis conducted on geographies consisting of 186,153,445 people shows no correlation between the proportion of Immigrants from Iraq and unemployment rate among population between the ages 60 and 64 in the United States with a correlation coefficient (R) of 0.010 and weighted average of 4.5%, a difference of 3.4%.
Czechoslovakian vs Immigrants from Iraq Unemployment Among Ages 60 to 64 years

Unemployment Among Ages 60 to 64 years Correlation Summary

MeasurementCzechoslovakianImmigrants from Iraq
Minimum0.40%1.1%
Maximum25.7%8.8%
Range25.3%7.7%
Mean9.5%4.3%
Median8.3%4.0%
Interquartile 25% (IQ1)5.3%3.3%
Interquartile 75% (IQ3)12.3%5.1%
Interquartile Range (IQR)7.0%1.8%
Standard Deviation (Sample)6.0%1.7%
Standard Deviation (Population)5.9%1.6%

Similar Demographics by Unemployment Among Ages 60 to 64 years

Demographics Similar to Czechoslovakians by Unemployment Among Ages 60 to 64 years

In terms of unemployment among ages 60 to 64 years, the demographic groups most similar to Czechoslovakians are Immigrants from Middle Africa (4.6%, a difference of 0.020%), Senegalese (4.6%, a difference of 0.030%), Jordanian (4.6%, a difference of 0.040%), Lebanese (4.6%, a difference of 0.13%), and Hawaiian (4.6%, a difference of 0.24%).
DemographicsRating | RankUnemployment Among Ages 60 to 64 years
Welsh
99.9
/100
|
#56
Exceptional
4.6%
British
99.9
/100
|
#57
Exceptional
4.6%
Immigrants | India
99.8
/100
|
#58
Exceptional
4.6%
Swiss
99.8
/100
|
#59
Exceptional
4.6%
Puget Sound Salish
99.8
/100
|
#60
Exceptional
4.6%
Lebanese
99.8
/100
|
#61
Exceptional
4.6%
Senegalese
99.7
/100
|
#62
Exceptional
4.6%
Czechoslovakians
99.7
/100
|
#63
Exceptional
4.6%
Immigrants | Middle Africa
99.7
/100
|
#64
Exceptional
4.6%
Jordanians
99.7
/100
|
#65
Exceptional
4.6%
Hawaiians
99.6
/100
|
#66
Exceptional
4.6%
Immigrants | Scotland
99.6
/100
|
#67
Exceptional
4.6%
Immigrants | Laos
99.6
/100
|
#68
Exceptional
4.6%
Creek
99.6
/100
|
#69
Exceptional
4.6%
Croatians
99.5
/100
|
#70
Exceptional
4.6%

Demographics Similar to Immigrants from Iraq by Unemployment Among Ages 60 to 64 years

In terms of unemployment among ages 60 to 64 years, the demographic groups most similar to Immigrants from Iraq are Immigrants from Nepal (4.5%, a difference of 0.070%), Czech (4.4%, a difference of 0.080%), Yugoslavian (4.4%, a difference of 0.18%), Cuban (4.5%, a difference of 0.31%), and Immigrants from Venezuela (4.5%, a difference of 0.33%).
DemographicsRating | RankUnemployment Among Ages 60 to 64 years
Afghans
100.0
/100
|
#20
Exceptional
4.4%
Immigrants | Cabo Verde
100.0
/100
|
#21
Exceptional
4.4%
Cape Verdeans
100.0
/100
|
#22
Exceptional
4.4%
Immigrants | Zaire
100.0
/100
|
#23
Exceptional
4.4%
Immigrants | Burma/Myanmar
100.0
/100
|
#24
Exceptional
4.4%
Yugoslavians
100.0
/100
|
#25
Exceptional
4.4%
Czechs
100.0
/100
|
#26
Exceptional
4.4%
Immigrants | Iraq
100.0
/100
|
#27
Exceptional
4.5%
Immigrants | Nepal
100.0
/100
|
#28
Exceptional
4.5%
Cubans
100.0
/100
|
#29
Exceptional
4.5%
Immigrants | Venezuela
100.0
/100
|
#30
Exceptional
4.5%
Immigrants | Eritrea
100.0
/100
|
#31
Exceptional
4.5%
Zimbabweans
100.0
/100
|
#32
Exceptional
4.5%
Carpatho Rusyns
100.0
/100
|
#33
Exceptional
4.5%
Belgians
100.0
/100
|
#34
Exceptional
4.5%