Czechoslovakian vs Immigrants from Caribbean Unemployment Among Seniors over 75 years

COMPARE

Czechoslovakian
Race
Ancestry
AfghanAfricanAlaska NativeAlaskan AthabascanAlbanianAleutAlsatianAmericanApacheArabArapahoArgentineanArmenianAssyrian/Chaldean/SyriacAustralianAustrianBahamianBangladeshiBarbadianBasqueBelgianBelizeanBermudanBhutaneseBlackfeetBolivianBrazilianBritishBritish West IndianBulgarianBurmeseCajunCambodianCanadianCape VerdeanCarpatho RusynCelticCentral AmericanCentral American IndianCherokeeCheyenneChickasawChileanChineseChippewaChoctawColombianColvilleComancheCosta RicanCreeCreekCroatianCrowCubanCypriotCzechCzechoslovakianDanishDelawareDominicanDutchDutch West IndianEastern EuropeanEcuadorianEgyptianEnglishEstonianEthiopianEuropeanFijianFilipinoFinnishFrenchFrench American IndianFrench CanadianGermanGerman RussianGhanaianGreekGuamanian/ChamorroGuatemalanGuyaneseHaitianHmongHonduranHopiHoumaHungarianIcelanderIndian (Asian)IndonesianInupiatIranianIraqiIrishIroquoisIsraeliItalianJamaicanJapaneseJordanianKenyanKiowaKoreanLaotianLatvianLebaneseLiberianLithuanianLumbeeLuxembourgerMacedonianMalaysianMalteseMarshalleseMexicanMexican American IndianMongolianMoroccanNative HawaiianNavajoNepaleseNew ZealanderNicaraguanNigerianNorthern EuropeanNorwegianOkinawanOsageOttawaPaiutePakistaniPalestinianPanamanianParaguayanPennsylvania GermanPeruvianPimaPolishPortuguesePotawatomiPuebloPuerto RicanPuget Sound SalishRomanianRussianSalvadoranSamoanScandinavianScotch-IrishScottishSeminoleSenegaleseSerbianShoshoneSierra LeoneanSiouxSlavicSlovakSloveneSomaliSouth AfricanSouth AmericanSouth American IndianSoviet UnionSpaniardSpanishSpanish AmericanSpanish American IndianSri LankanSubsaharan AfricanSudaneseSwedishSwissSyrianTaiwaneseThaiTlingit-HaidaTohono O'OdhamTonganTrinidadian and TobagonianTsimshianTurkishU.S. Virgin IslanderUgandanUkrainianUruguayanUteVenezuelanVietnameseWelshWest IndianYakamaYaquiYugoslavianYumanYup'ikZimbabwean
Immigration
NonimmigrantsImmigrantsAfghanistanAfricaAlbaniaArgentinaArmeniaAsiaAustraliaAustriaBahamasBangladeshBarbadosBelarusBelgiumBelizeBoliviaBosnia and HerzegovinaBrazilBulgariaBurma/MyanmarCabo VerdeCambodiaCameroonCanadaCentral AmericaChileChinaColombiaCongoCosta RicaCroatiaCubaCzechoslovakiaDenmarkDominicaDominican RepublicEastern AfricaEastern AsiaEastern EuropeEcuadorEgyptEl SalvadorEnglandEritreaEthiopiaEuropeFijiFranceGermanyGhanaGreeceGrenadaGuatemalaGuyanaHaitiHondurasHong KongHungaryIndiaIndonesiaIranIraqIrelandIsraelItalyJamaicaJapanJordanKazakhstanKenyaKoreaKuwaitLaosLatin AmericaLatviaLebanonLiberiaLithuaniaMalaysiaMexicoMicronesiaMiddle AfricaMoldovaMoroccoNepalNetherlandsNicaraguaNigeriaNorth AmericaNorth MacedoniaNorthern AfricaNorthern EuropeNorwayOceaniaPakistanPanamaPeruPhilippinesPolandPortugalRomaniaRussiaSaudi ArabiaScotlandSenegalSerbiaSierra LeoneSingaporeSomaliaSouth AfricaSouth AmericaSouth Central AsiaSouth Eastern AsiaSouthern EuropeSpainSri LankaSt. Vincent and the GrenadinesSudanSwedenSwitzerlandSyriaTaiwanThailandTrinidad and TobagoTurkeyUgandaUkraineUruguayUzbekistanVenezuelaVietnamWest IndiesWestern AfricaWestern AsiaWestern EuropeYemenZaireZimbabweAzores
Immigrants from Caribbean
Race
Ancestry
AfghanAfricanAlaska NativeAlaskan AthabascanAlbanianAleutAlsatianAmericanApacheArabArapahoArgentineanArmenianAssyrian/Chaldean/SyriacAustralianAustrianBahamianBangladeshiBarbadianBasqueBelgianBelizeanBermudanBhutaneseBlackfeetBolivianBrazilianBritishBritish West IndianBulgarianBurmeseCajunCambodianCanadianCape VerdeanCarpatho RusynCelticCentral AmericanCentral American IndianCherokeeCheyenneChickasawChileanChineseChippewaChoctawColombianColvilleComancheCosta RicanCreeCreekCroatianCrowCubanCypriotCzechDanishDelawareDominicanDutchDutch West IndianEastern EuropeanEcuadorianEgyptianEnglishEstonianEthiopianEuropeanFijianFilipinoFinnishFrenchFrench American IndianFrench CanadianGermanGerman RussianGhanaianGreekGuamanian/ChamorroGuatemalanGuyaneseHaitianHmongHonduranHopiHoumaHungarianIcelanderIndian (Asian)IndonesianInupiatIranianIraqiIrishIroquoisIsraeliItalianJamaicanJapaneseJordanianKenyanKiowaKoreanLaotianLatvianLebaneseLiberianLithuanianLumbeeLuxembourgerMacedonianMalaysianMalteseMarshalleseMexicanMexican American IndianMongolianMoroccanNative HawaiianNavajoNepaleseNew ZealanderNicaraguanNigerianNorthern EuropeanNorwegianOkinawanOsageOttawaPaiutePakistaniPalestinianPanamanianParaguayanPennsylvania GermanPeruvianPimaPolishPortuguesePotawatomiPuebloPuerto RicanPuget Sound SalishRomanianRussianSalvadoranSamoanScandinavianScotch-IrishScottishSeminoleSenegaleseSerbianShoshoneSierra LeoneanSiouxSlavicSlovakSloveneSomaliSouth AfricanSouth AmericanSouth American IndianSoviet UnionSpaniardSpanishSpanish AmericanSpanish American IndianSri LankanSubsaharan AfricanSudaneseSwedishSwissSyrianTaiwaneseThaiTlingit-HaidaTohono O'OdhamTonganTrinidadian and TobagonianTsimshianTurkishU.S. Virgin IslanderUgandanUkrainianUruguayanUteVenezuelanVietnameseWelshWest IndianYakamaYaquiYugoslavianYumanYup'ikZimbabwean
Immigration
NonimmigrantsImmigrantsAfghanistanAfricaAlbaniaArgentinaArmeniaAsiaAustraliaAustriaBahamasBangladeshBarbadosBelarusBelgiumBelizeBoliviaBosnia and HerzegovinaBrazilBulgariaBurma/MyanmarCabo VerdeCambodiaCameroonCanadaCaribbeanCentral AmericaChileChinaColombiaCongoCosta RicaCroatiaCubaCzechoslovakiaDenmarkDominicaDominican RepublicEastern AfricaEastern AsiaEastern EuropeEcuadorEgyptEl SalvadorEnglandEritreaEthiopiaEuropeFijiFranceGermanyGhanaGreeceGrenadaGuatemalaGuyanaHaitiHondurasHong KongHungaryIndiaIndonesiaIranIraqIrelandIsraelItalyJamaicaJapanJordanKazakhstanKenyaKoreaKuwaitLaosLatin AmericaLatviaLebanonLiberiaLithuaniaMalaysiaMexicoMicronesiaMiddle AfricaMoldovaMoroccoNepalNetherlandsNicaraguaNigeriaNorth AmericaNorth MacedoniaNorthern AfricaNorthern EuropeNorwayOceaniaPakistanPanamaPeruPhilippinesPolandPortugalRomaniaRussiaSaudi ArabiaScotlandSenegalSerbiaSierra LeoneSingaporeSomaliaSouth AfricaSouth AmericaSouth Central AsiaSouth Eastern AsiaSouthern EuropeSpainSri LankaSt. Vincent and the GrenadinesSudanSwedenSwitzerlandSyriaTaiwanThailandTrinidad and TobagoTurkeyUgandaUkraineUruguayUzbekistanVenezuelaVietnamWest IndiesWestern AfricaWestern AsiaWestern EuropeYemenZaireZimbabweAzores
Unemployment Among Seniors over 75 years
Income
Poverty
Unemployment
Labor Participation
Family Structure
Vehicle Availability
Education Level
Disability

Unemployment Among Seniors over 75 years Comparison

Czechoslovakians

Immigrants from Caribbean

Tragic
Exceptional
9.4%
UNEMPLOYMENT AMONG SENIORS OVER 75 YEARS
0.3/ 100
METRIC RATING
273rd/ 347
METRIC RANK
8.2%
UNEMPLOYMENT AMONG SENIORS OVER 75 YEARS
99.0/ 100
METRIC RATING
105th/ 347
METRIC RANK

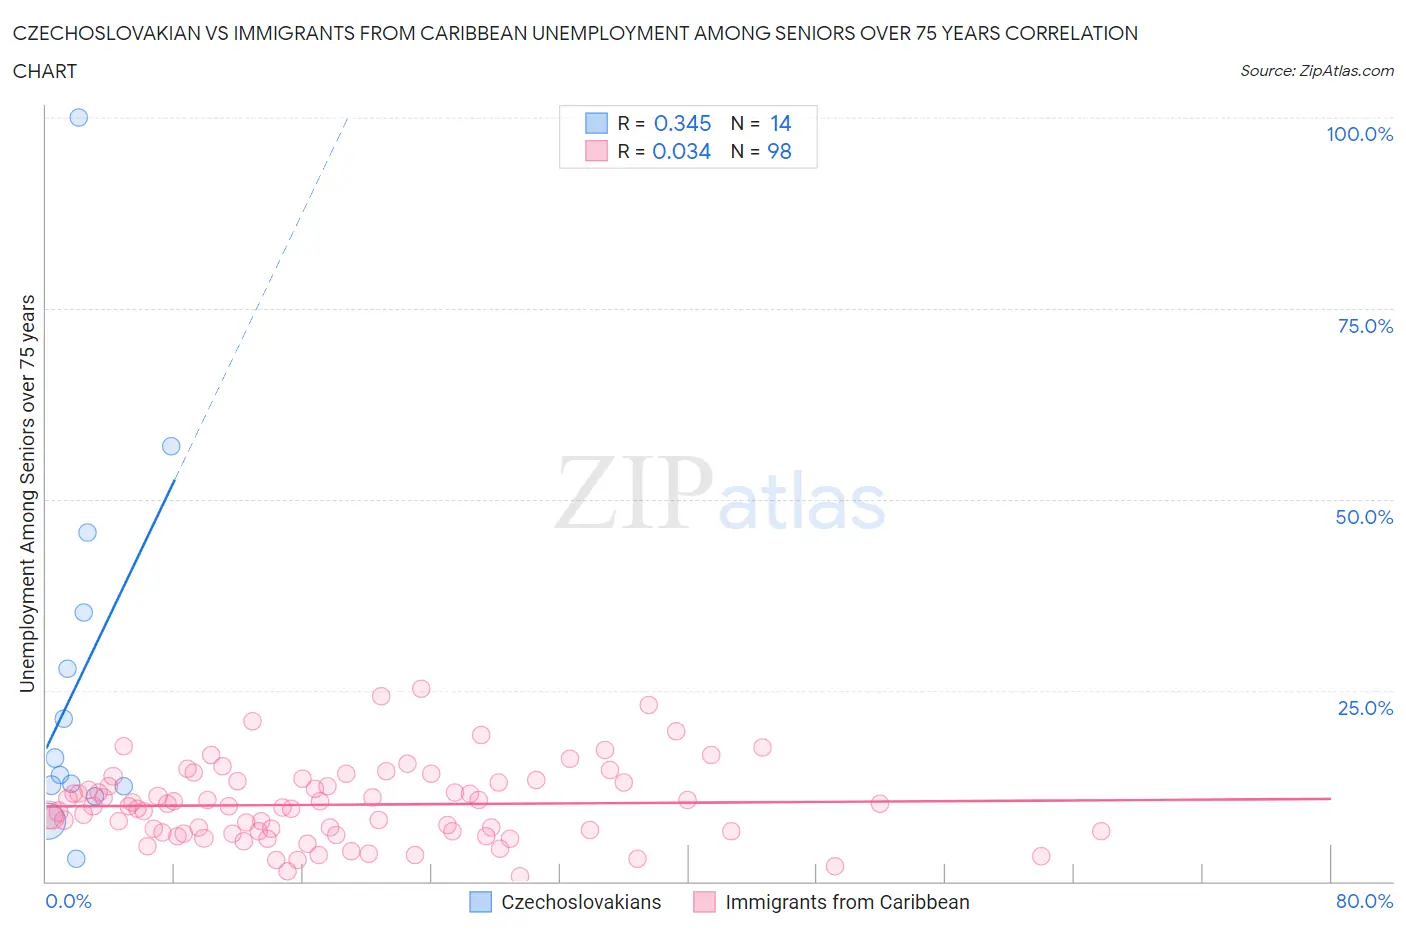
Czechoslovakian vs Immigrants from Caribbean Unemployment Among Seniors over 75 years Correlation Chart

The statistical analysis conducted on geographies consisting of 187,754,654 people shows a mild positive correlation between the proportion of Czechoslovakians and unemployment rate among seniors over the age of 75 in the United States with a correlation coefficient (R) of 0.345 and weighted average of 9.4%. Similarly, the statistical analysis conducted on geographies consisting of 215,050,799 people shows no correlation between the proportion of Immigrants from Caribbean and unemployment rate among seniors over the age of 75 in the United States with a correlation coefficient (R) of 0.034 and weighted average of 8.2%, a difference of 15.1%.
Czechoslovakian vs Immigrants from Caribbean Unemployment Among Seniors over 75 years

Unemployment Among Seniors over 75 years Correlation Summary

MeasurementCzechoslovakianImmigrants from Caribbean
Minimum2.9%0.63%
Maximum100.0%25.3%
Range97.1%24.6%
Mean26.9%10.0%
Median15.0%9.8%
Interquartile 25% (IQ1)12.5%6.5%
Interquartile 75% (IQ3)35.2%13.0%
Interquartile Range (IQR)22.7%6.5%
Standard Deviation (Sample)26.0%5.0%
Standard Deviation (Population)25.0%5.0%

Similar Demographics by Unemployment Among Seniors over 75 years

Demographics Similar to Czechoslovakians by Unemployment Among Seniors over 75 years

In terms of unemployment among seniors over 75 years, the demographic groups most similar to Czechoslovakians are Jamaican (9.5%, a difference of 0.12%), Immigrants from Iraq (9.4%, a difference of 0.14%), Bulgarian (9.4%, a difference of 0.17%), Yaqui (9.4%, a difference of 0.25%), and Senegalese (9.5%, a difference of 0.32%).
DemographicsRating | RankUnemployment Among Seniors over 75 years
Blacks/African Americans
0.5
/100
|
#266
Tragic
9.4%
Immigrants | Mexico
0.4
/100
|
#267
Tragic
9.4%
Greeks
0.4
/100
|
#268
Tragic
9.4%
Puerto Ricans
0.3
/100
|
#269
Tragic
9.4%
Yaqui
0.3
/100
|
#270
Tragic
9.4%
Bulgarians
0.3
/100
|
#271
Tragic
9.4%
Immigrants | Iraq
0.3
/100
|
#272
Tragic
9.4%
Czechoslovakians
0.3
/100
|
#273
Tragic
9.4%
Jamaicans
0.2
/100
|
#274
Tragic
9.5%
Senegalese
0.2
/100
|
#275
Tragic
9.5%
Arabs
0.2
/100
|
#276
Tragic
9.5%
Swiss
0.1
/100
|
#277
Tragic
9.5%
Immigrants | Senegal
0.1
/100
|
#278
Tragic
9.6%
British
0.1
/100
|
#279
Tragic
9.6%
Croatians
0.1
/100
|
#280
Tragic
9.6%

Demographics Similar to Immigrants from Caribbean by Unemployment Among Seniors over 75 years

In terms of unemployment among seniors over 75 years, the demographic groups most similar to Immigrants from Caribbean are Immigrants from Honduras (8.2%, a difference of 0.010%), Immigrants from South Central Asia (8.2%, a difference of 0.020%), South American Indian (8.2%, a difference of 0.050%), Sri Lankan (8.2%, a difference of 0.17%), and Immigrants from Panama (8.2%, a difference of 0.20%).
DemographicsRating | RankUnemployment Among Seniors over 75 years
Immigrants | Northern Africa
99.3
/100
|
#98
Exceptional
8.2%
Burmese
99.2
/100
|
#99
Exceptional
8.2%
Immigrants | Kazakhstan
99.2
/100
|
#100
Exceptional
8.2%
Immigrants | Serbia
99.2
/100
|
#101
Exceptional
8.2%
Immigrants | Panama
99.1
/100
|
#102
Exceptional
8.2%
South American Indians
99.1
/100
|
#103
Exceptional
8.2%
Immigrants | South Central Asia
99.0
/100
|
#104
Exceptional
8.2%
Immigrants | Caribbean
99.0
/100
|
#105
Exceptional
8.2%
Immigrants | Honduras
99.0
/100
|
#106
Exceptional
8.2%
Sri Lankans
98.9
/100
|
#107
Exceptional
8.2%
Laotians
98.8
/100
|
#108
Exceptional
8.2%
Immigrants | Lebanon
98.8
/100
|
#109
Exceptional
8.2%
Marshallese
98.7
/100
|
#110
Exceptional
8.2%
French American Indians
98.7
/100
|
#111
Exceptional
8.2%
Immigrants | India
98.6
/100
|
#112
Exceptional
8.2%