Cypriot vs Pakistani Female Unemployment

COMPARE

Cypriot
Race
Ancestry
AfghanAfricanAlaska NativeAlaskan AthabascanAlbanianAleutAlsatianAmericanApacheArabArapahoArgentineanArmenianAssyrian/Chaldean/SyriacAustralianAustrianBahamianBangladeshiBarbadianBasqueBelgianBelizeanBermudanBhutaneseBlackfeetBolivianBrazilianBritishBritish West IndianBulgarianBurmeseCajunCambodianCanadianCape VerdeanCarpatho RusynCelticCentral AmericanCentral American IndianCherokeeCheyenneChickasawChileanChineseChippewaChoctawColombianColvilleComancheCosta RicanCreeCreekCroatianCrowCubanCypriotCzechCzechoslovakianDanishDelawareDominicanDutchDutch West IndianEastern EuropeanEcuadorianEgyptianEnglishEstonianEthiopianEuropeanFijianFilipinoFinnishFrenchFrench American IndianFrench CanadianGermanGerman RussianGhanaianGreekGuamanian/ChamorroGuatemalanGuyaneseHaitianHmongHonduranHopiHoumaHungarianIcelanderIndian (Asian)IndonesianInupiatIranianIraqiIrishIroquoisIsraeliItalianJamaicanJapaneseJordanianKenyanKiowaKoreanLaotianLatvianLebaneseLiberianLithuanianLumbeeLuxembourgerMacedonianMalaysianMalteseMarshalleseMenomineeMexicanMexican American IndianMongolianMoroccanNative HawaiianNavajoNepaleseNew ZealanderNicaraguanNigerianNorthern EuropeanNorwegianOkinawanOsageOttawaPaiutePalestinianPanamanianParaguayanPennsylvania GermanPeruvianPimaPolishPortuguesePotawatomiPuebloPuerto RicanPuget Sound SalishRomanianRussianSalvadoranSamoanScandinavianScotch-IrishScottishSeminoleSenegaleseSerbianShoshoneSierra LeoneanSiouxSlavicSlovakSloveneSomaliSouth AfricanSouth AmericanSouth American IndianSoviet UnionSpaniardSpanishSpanish AmericanSpanish American IndianSri LankanSubsaharan AfricanSudaneseSwedishSwissSyrianTaiwaneseThaiTlingit-HaidaTohono O'OdhamTonganTrinidadian and TobagonianTsimshianTurkishU.S. Virgin IslanderUgandanUkrainianUruguayanUteVenezuelanVietnameseWelshWest IndianYakamaYaquiYugoslavianYumanYup'ikZimbabwean
Immigration
NonimmigrantsImmigrantsAfghanistanAfricaAlbaniaArgentinaArmeniaAsiaAustraliaAustriaBahamasBangladeshBarbadosBelarusBelgiumBelizeBoliviaBosnia and HerzegovinaBrazilBulgariaBurma/MyanmarCabo VerdeCambodiaCameroonCanadaCaribbeanCentral AmericaChileChinaColombiaCongoCosta RicaCroatiaCubaCzechoslovakiaDenmarkDominicaDominican RepublicEastern AfricaEastern AsiaEastern EuropeEcuadorEgyptEl SalvadorEnglandEritreaEthiopiaEuropeFijiFranceGermanyGhanaGreeceGrenadaGuatemalaGuyanaHaitiHondurasHong KongHungaryIndiaIndonesiaIranIraqIrelandIsraelItalyJamaicaJapanJordanKazakhstanKenyaKoreaKuwaitLaosLatin AmericaLatviaLebanonLiberiaLithuaniaMalaysiaMexicoMicronesiaMiddle AfricaMoldovaMoroccoNepalNetherlandsNicaraguaNigeriaNorth AmericaNorth MacedoniaNorthern AfricaNorthern EuropeNorwayOceaniaPakistanPanamaPeruPhilippinesPolandPortugalRomaniaRussiaSaudi ArabiaScotlandSenegalSerbiaSierra LeoneSingaporeSomaliaSouth AfricaSouth AmericaSouth Central AsiaSouth Eastern AsiaSouthern EuropeSpainSri LankaSt. Vincent and the GrenadinesSudanSwedenSwitzerlandSyriaTaiwanThailandTrinidad and TobagoTurkeyUgandaUkraineUruguayUzbekistanVenezuelaVietnamWest IndiesWestern AfricaWestern AsiaWestern EuropeYemenZaireZimbabweAzores
Pakistani
Race
Ancestry
AfghanAfricanAlaska NativeAlaskan AthabascanAlbanianAleutAlsatianAmericanApacheArabArapahoArgentineanArmenianAssyrian/Chaldean/SyriacAustralianAustrianBahamianBangladeshiBarbadianBasqueBelgianBelizeanBermudanBhutaneseBlackfeetBolivianBrazilianBritishBritish West IndianBulgarianBurmeseCajunCambodianCanadianCape VerdeanCarpatho RusynCelticCentral AmericanCentral American IndianCherokeeCheyenneChickasawChileanChineseChippewaChoctawColombianColvilleComancheCosta RicanCreeCreekCroatianCrowCubanCzechCzechoslovakianDanishDelawareDominicanDutchDutch West IndianEastern EuropeanEcuadorianEgyptianEnglishEstonianEthiopianEuropeanFijianFilipinoFinnishFrenchFrench American IndianFrench CanadianGermanGerman RussianGhanaianGreekGuamanian/ChamorroGuatemalanGuyaneseHaitianHmongHonduranHopiHoumaHungarianIcelanderIndian (Asian)IndonesianInupiatIranianIraqiIrishIroquoisIsraeliItalianJamaicanJapaneseJordanianKenyanKiowaKoreanLaotianLatvianLebaneseLiberianLithuanianLumbeeLuxembourgerMacedonianMalaysianMalteseMarshalleseMenomineeMexicanMexican American IndianMongolianMoroccanNative HawaiianNavajoNepaleseNew ZealanderNicaraguanNigerianNorthern EuropeanNorwegianOkinawanOsageOttawaPaiutePakistaniPalestinianPanamanianParaguayanPennsylvania GermanPeruvianPimaPolishPortuguesePotawatomiPuebloPuerto RicanPuget Sound SalishRomanianRussianSalvadoranSamoanScandinavianScotch-IrishScottishSeminoleSenegaleseSerbianShoshoneSierra LeoneanSiouxSlavicSlovakSloveneSomaliSouth AfricanSouth AmericanSouth American IndianSoviet UnionSpaniardSpanishSpanish AmericanSpanish American IndianSri LankanSubsaharan AfricanSudaneseSwedishSwissSyrianTaiwaneseThaiTlingit-HaidaTohono O'OdhamTonganTrinidadian and TobagonianTsimshianTurkishU.S. Virgin IslanderUgandanUkrainianUruguayanUteVenezuelanVietnameseWelshWest IndianYakamaYaquiYugoslavianYumanYup'ikZimbabwean
Immigration
NonimmigrantsImmigrantsAfghanistanAfricaAlbaniaArgentinaArmeniaAsiaAustraliaAustriaBahamasBangladeshBarbadosBelarusBelgiumBelizeBoliviaBosnia and HerzegovinaBrazilBulgariaBurma/MyanmarCabo VerdeCambodiaCameroonCanadaCaribbeanCentral AmericaChileChinaColombiaCongoCosta RicaCroatiaCubaCzechoslovakiaDenmarkDominicaDominican RepublicEastern AfricaEastern AsiaEastern EuropeEcuadorEgyptEl SalvadorEnglandEritreaEthiopiaEuropeFijiFranceGermanyGhanaGreeceGrenadaGuatemalaGuyanaHaitiHondurasHong KongHungaryIndiaIndonesiaIranIraqIrelandIsraelItalyJamaicaJapanJordanKazakhstanKenyaKoreaKuwaitLaosLatin AmericaLatviaLebanonLiberiaLithuaniaMalaysiaMexicoMicronesiaMiddle AfricaMoldovaMoroccoNepalNetherlandsNicaraguaNigeriaNorth AmericaNorth MacedoniaNorthern AfricaNorthern EuropeNorwayOceaniaPakistanPanamaPeruPhilippinesPolandPortugalRomaniaRussiaSaudi ArabiaScotlandSenegalSerbiaSierra LeoneSingaporeSomaliaSouth AfricaSouth AmericaSouth Central AsiaSouth Eastern AsiaSouthern EuropeSpainSri LankaSt. Vincent and the GrenadinesSudanSwedenSwitzerlandSyriaTaiwanThailandTrinidad and TobagoTurkeyUgandaUkraineUruguayUzbekistanVenezuelaVietnamWest IndiesWestern AfricaWestern AsiaWestern EuropeYemenZaireZimbabweAzores
Female Unemployment
Income
Poverty
Unemployment
Labor Participation
Family Structure
Vehicle Availability
Education Level
Disability

Female Unemployment Comparison

Cypriots

Pakistanis

Exceptional
Excellent
4.7%
FEMALE UNEMPLOYMENT
99.9/ 100
METRIC RATING
29th/ 347
METRIC RANK
5.1%
FEMALE UNEMPLOYMENT
83.8/ 100
METRIC RATING
137th/ 347
METRIC RANK

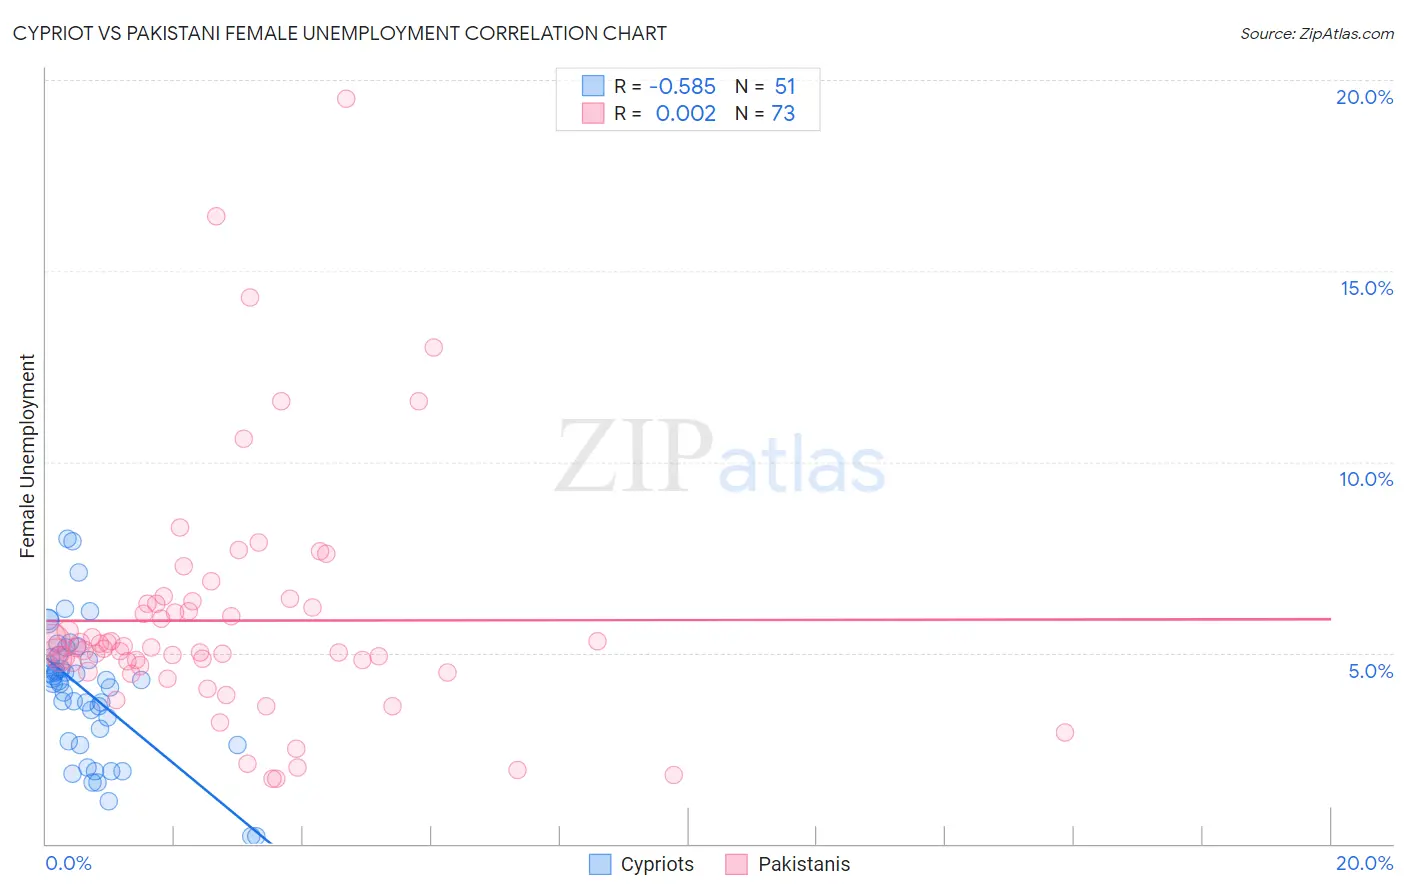
Cypriot vs Pakistani Female Unemployment Correlation Chart

The statistical analysis conducted on geographies consisting of 61,829,188 people shows a substantial negative correlation between the proportion of Cypriots and unemploymnet rate among females in the United States with a correlation coefficient (R) of -0.585 and weighted average of 4.7%. Similarly, the statistical analysis conducted on geographies consisting of 334,292,014 people shows no correlation between the proportion of Pakistanis and unemploymnet rate among females in the United States with a correlation coefficient (R) of 0.002 and weighted average of 5.1%, a difference of 8.2%.
Cypriot vs Pakistani Female Unemployment

Female Unemployment Correlation Summary

MeasurementCypriotPakistani
Minimum0.20%1.7%
Maximum8.0%19.5%
Range7.8%17.8%
Mean4.0%5.8%
Median4.3%5.1%
Interquartile 25% (IQ1)2.7%4.6%
Interquartile 75% (IQ3)4.9%6.3%
Interquartile Range (IQR)2.2%1.7%
Standard Deviation (Sample)1.7%3.1%
Standard Deviation (Population)1.7%3.1%

Similar Demographics by Female Unemployment

Demographics Similar to Cypriots by Female Unemployment

In terms of female unemployment, the demographic groups most similar to Cypriots are Irish (4.7%, a difference of 0.010%), British (4.7%, a difference of 0.040%), Lithuanian (4.7%, a difference of 0.12%), Immigrants from Bosnia and Herzegovina (4.7%, a difference of 0.20%), and Immigrants from India (4.7%, a difference of 0.24%).
DemographicsRating | RankFemale Unemployment
Europeans
99.9
/100
|
#22
Exceptional
4.7%
Scottish
99.9
/100
|
#23
Exceptional
4.7%
Welsh
99.9
/100
|
#24
Exceptional
4.7%
Immigrants | India
99.9
/100
|
#25
Exceptional
4.7%
Immigrants | Bosnia and Herzegovina
99.9
/100
|
#26
Exceptional
4.7%
British
99.9
/100
|
#27
Exceptional
4.7%
Irish
99.9
/100
|
#28
Exceptional
4.7%
Cypriots
99.9
/100
|
#29
Exceptional
4.7%
Lithuanians
99.8
/100
|
#30
Exceptional
4.7%
Sudanese
99.8
/100
|
#31
Exceptional
4.8%
Slovaks
99.8
/100
|
#32
Exceptional
4.8%
Czechoslovakians
99.7
/100
|
#33
Exceptional
4.8%
Zimbabweans
99.7
/100
|
#34
Exceptional
4.8%
French Canadians
99.7
/100
|
#35
Exceptional
4.8%
Yugoslavians
99.7
/100
|
#36
Exceptional
4.8%

Demographics Similar to Pakistanis by Female Unemployment

In terms of female unemployment, the demographic groups most similar to Pakistanis are Indian (Asian) (5.1%, a difference of 0.040%), Chickasaw (5.1%, a difference of 0.060%), Immigrants from Eastern Asia (5.1%, a difference of 0.080%), Immigrants from Eritrea (5.1%, a difference of 0.090%), and Immigrants from Latvia (5.1%, a difference of 0.090%).
DemographicsRating | RankFemale Unemployment
Maltese
85.5
/100
|
#130
Excellent
5.1%
Immigrants | Ethiopia
85.4
/100
|
#131
Excellent
5.1%
Immigrants | Sri Lanka
85.0
/100
|
#132
Excellent
5.1%
Immigrants | Hong Kong
84.8
/100
|
#133
Excellent
5.1%
Immigrants | Eritrea
84.6
/100
|
#134
Excellent
5.1%
Immigrants | Latvia
84.6
/100
|
#135
Excellent
5.1%
Indians (Asian)
84.2
/100
|
#136
Excellent
5.1%
Pakistanis
83.8
/100
|
#137
Excellent
5.1%
Chickasaw
83.2
/100
|
#138
Excellent
5.1%
Immigrants | Eastern Asia
83.0
/100
|
#139
Excellent
5.1%
Immigrants | France
82.7
/100
|
#140
Excellent
5.1%
Immigrants | Eastern Europe
81.5
/100
|
#141
Excellent
5.1%
Palestinians
80.8
/100
|
#142
Excellent
5.1%
Immigrants | Kazakhstan
80.7
/100
|
#143
Excellent
5.1%
Immigrants | Jordan
80.4
/100
|
#144
Excellent
5.1%