Cypriot vs Immigrants from Sierra Leone Unemployment Among Ages 20 to 24 years

COMPARE

Cypriot
Race
Ancestry
AfghanAfricanAlaska NativeAlaskan AthabascanAlbanianAleutAlsatianAmericanApacheArabArapahoArgentineanArmenianAssyrian/Chaldean/SyriacAustralianAustrianBahamianBangladeshiBarbadianBasqueBelgianBelizeanBermudanBhutaneseBlackfeetBolivianBrazilianBritishBritish West IndianBulgarianBurmeseCajunCambodianCanadianCape VerdeanCarpatho RusynCelticCentral AmericanCentral American IndianCherokeeCheyenneChickasawChileanChineseChippewaChoctawColombianColvilleComancheCosta RicanCreeCreekCroatianCrowCubanCypriotCzechCzechoslovakianDanishDelawareDominicanDutchDutch West IndianEastern EuropeanEcuadorianEgyptianEnglishEstonianEthiopianEuropeanFijianFilipinoFinnishFrenchFrench American IndianFrench CanadianGermanGerman RussianGhanaianGreekGuamanian/ChamorroGuatemalanGuyaneseHaitianHmongHonduranHopiHoumaHungarianIcelanderIndian (Asian)IndonesianInupiatIranianIraqiIrishIroquoisIsraeliItalianJamaicanJapaneseJordanianKenyanKiowaKoreanLaotianLatvianLebaneseLiberianLithuanianLumbeeLuxembourgerMacedonianMalaysianMalteseMarshalleseMenomineeMexicanMexican American IndianMongolianMoroccanNative HawaiianNavajoNepaleseNew ZealanderNicaraguanNigerianNorthern EuropeanNorwegianOkinawanOsageOttawaPaiutePakistaniPalestinianPanamanianParaguayanPennsylvania GermanPeruvianPimaPolishPortuguesePotawatomiPuebloPuerto RicanPuget Sound SalishRomanianRussianSalvadoranSamoanScandinavianScotch-IrishScottishSeminoleSenegaleseSerbianShoshoneSierra LeoneanSiouxSlavicSlovakSloveneSomaliSouth AfricanSouth AmericanSouth American IndianSoviet UnionSpaniardSpanishSpanish AmericanSpanish American IndianSri LankanSubsaharan AfricanSudaneseSwedishSwissSyrianTaiwaneseThaiTlingit-HaidaTohono O'OdhamTonganTrinidadian and TobagonianTsimshianTurkishU.S. Virgin IslanderUgandanUkrainianUruguayanUteVenezuelanVietnameseWelshWest IndianYakamaYaquiYugoslavianYumanYup'ikZimbabwean
Immigration
NonimmigrantsImmigrantsAfghanistanAfricaAlbaniaArgentinaArmeniaAsiaAustraliaAustriaBahamasBangladeshBarbadosBelarusBelgiumBelizeBoliviaBosnia and HerzegovinaBrazilBulgariaBurma/MyanmarCabo VerdeCambodiaCameroonCanadaCaribbeanCentral AmericaChileChinaColombiaCongoCosta RicaCroatiaCubaCzechoslovakiaDenmarkDominicaDominican RepublicEastern AfricaEastern AsiaEastern EuropeEcuadorEgyptEl SalvadorEnglandEritreaEthiopiaEuropeFijiFranceGermanyGhanaGreeceGrenadaGuatemalaGuyanaHaitiHondurasHong KongHungaryIndiaIndonesiaIranIraqIrelandIsraelItalyJamaicaJapanJordanKazakhstanKenyaKoreaKuwaitLaosLatin AmericaLatviaLebanonLiberiaLithuaniaMalaysiaMexicoMicronesiaMiddle AfricaMoldovaMoroccoNepalNetherlandsNicaraguaNigeriaNorth AmericaNorth MacedoniaNorthern AfricaNorthern EuropeNorwayOceaniaPakistanPanamaPeruPhilippinesPolandPortugalRomaniaRussiaSaudi ArabiaScotlandSenegalSerbiaSingaporeSomaliaSouth AfricaSouth AmericaSouth Central AsiaSouth Eastern AsiaSouthern EuropeSpainSri LankaSt. Vincent and the GrenadinesSudanSwedenSwitzerlandSyriaTaiwanThailandTrinidad and TobagoTurkeyUgandaUkraineUruguayUzbekistanVenezuelaVietnamWest IndiesWestern AfricaWestern AsiaWestern EuropeYemenZaireZimbabweAzores
Immigrants from Sierra Leone
Race
Ancestry
AfghanAfricanAlaska NativeAlaskan AthabascanAlbanianAleutAlsatianAmericanApacheArabArapahoArgentineanArmenianAssyrian/Chaldean/SyriacAustralianAustrianBahamianBangladeshiBarbadianBasqueBelgianBelizeanBermudanBhutaneseBlackfeetBolivianBrazilianBritishBritish West IndianBulgarianBurmeseCajunCambodianCanadianCape VerdeanCarpatho RusynCelticCentral AmericanCentral American IndianCherokeeCheyenneChickasawChileanChineseChippewaChoctawColombianColvilleComancheCosta RicanCreeCreekCroatianCrowCubanCzechCzechoslovakianDanishDelawareDominicanDutchDutch West IndianEastern EuropeanEcuadorianEgyptianEnglishEstonianEthiopianEuropeanFijianFilipinoFinnishFrenchFrench American IndianFrench CanadianGermanGerman RussianGhanaianGreekGuamanian/ChamorroGuatemalanGuyaneseHaitianHmongHonduranHopiHoumaHungarianIcelanderIndian (Asian)IndonesianInupiatIranianIraqiIrishIroquoisIsraeliItalianJamaicanJapaneseJordanianKenyanKiowaKoreanLaotianLatvianLebaneseLiberianLithuanianLumbeeLuxembourgerMacedonianMalaysianMalteseMarshalleseMenomineeMexicanMexican American IndianMongolianMoroccanNative HawaiianNavajoNepaleseNew ZealanderNicaraguanNigerianNorthern EuropeanNorwegianOkinawanOsageOttawaPaiutePakistaniPalestinianPanamanianParaguayanPennsylvania GermanPeruvianPimaPolishPortuguesePotawatomiPuebloPuerto RicanPuget Sound SalishRomanianRussianSalvadoranSamoanScandinavianScotch-IrishScottishSeminoleSenegaleseSerbianShoshoneSierra LeoneanSiouxSlavicSlovakSloveneSomaliSouth AfricanSouth AmericanSouth American IndianSoviet UnionSpaniardSpanishSpanish AmericanSpanish American IndianSri LankanSubsaharan AfricanSudaneseSwedishSwissSyrianTaiwaneseThaiTlingit-HaidaTohono O'OdhamTonganTrinidadian and TobagonianTsimshianTurkishU.S. Virgin IslanderUgandanUkrainianUruguayanUteVenezuelanVietnameseWelshWest IndianYakamaYaquiYugoslavianYumanYup'ikZimbabwean
Immigration
NonimmigrantsImmigrantsAfghanistanAfricaAlbaniaArgentinaArmeniaAsiaAustraliaAustriaBahamasBangladeshBarbadosBelarusBelgiumBelizeBoliviaBosnia and HerzegovinaBrazilBulgariaBurma/MyanmarCabo VerdeCambodiaCameroonCanadaCaribbeanCentral AmericaChileChinaColombiaCongoCosta RicaCroatiaCubaCzechoslovakiaDenmarkDominicaDominican RepublicEastern AfricaEastern AsiaEastern EuropeEcuadorEgyptEl SalvadorEnglandEritreaEthiopiaEuropeFijiFranceGermanyGhanaGreeceGrenadaGuatemalaGuyanaHaitiHondurasHong KongHungaryIndiaIndonesiaIranIraqIrelandIsraelItalyJamaicaJapanJordanKazakhstanKenyaKoreaKuwaitLaosLatin AmericaLatviaLebanonLiberiaLithuaniaMalaysiaMexicoMicronesiaMiddle AfricaMoldovaMoroccoNepalNetherlandsNicaraguaNigeriaNorth AmericaNorth MacedoniaNorthern AfricaNorthern EuropeNorwayOceaniaPakistanPanamaPeruPhilippinesPolandPortugalRomaniaRussiaSaudi ArabiaScotlandSenegalSerbiaSierra LeoneSingaporeSomaliaSouth AfricaSouth AmericaSouth Central AsiaSouth Eastern AsiaSouthern EuropeSpainSri LankaSt. Vincent and the GrenadinesSudanSwedenSwitzerlandSyriaTaiwanThailandTrinidad and TobagoTurkeyUgandaUkraineUruguayUzbekistanVenezuelaVietnamWest IndiesWestern AfricaWestern AsiaWestern EuropeYemenZaireZimbabweAzores
Unemployment Among Ages 20 to 24 years
Income
Poverty
Unemployment
Labor Participation
Family Structure
Vehicle Availability
Education Level
Disability

Unemployment Among Ages 20 to 24 years Comparison

Cypriots

Immigrants from Sierra Leone

Poor
Tragic
10.4%
UNEMPLOYMENT AMONG AGES 20 TO 24 YEARS
18.9/ 100
METRIC RATING
205th/ 347
METRIC RANK
12.1%
UNEMPLOYMENT AMONG AGES 20 TO 24 YEARS
0.0/ 100
METRIC RATING
301st/ 347
METRIC RANK

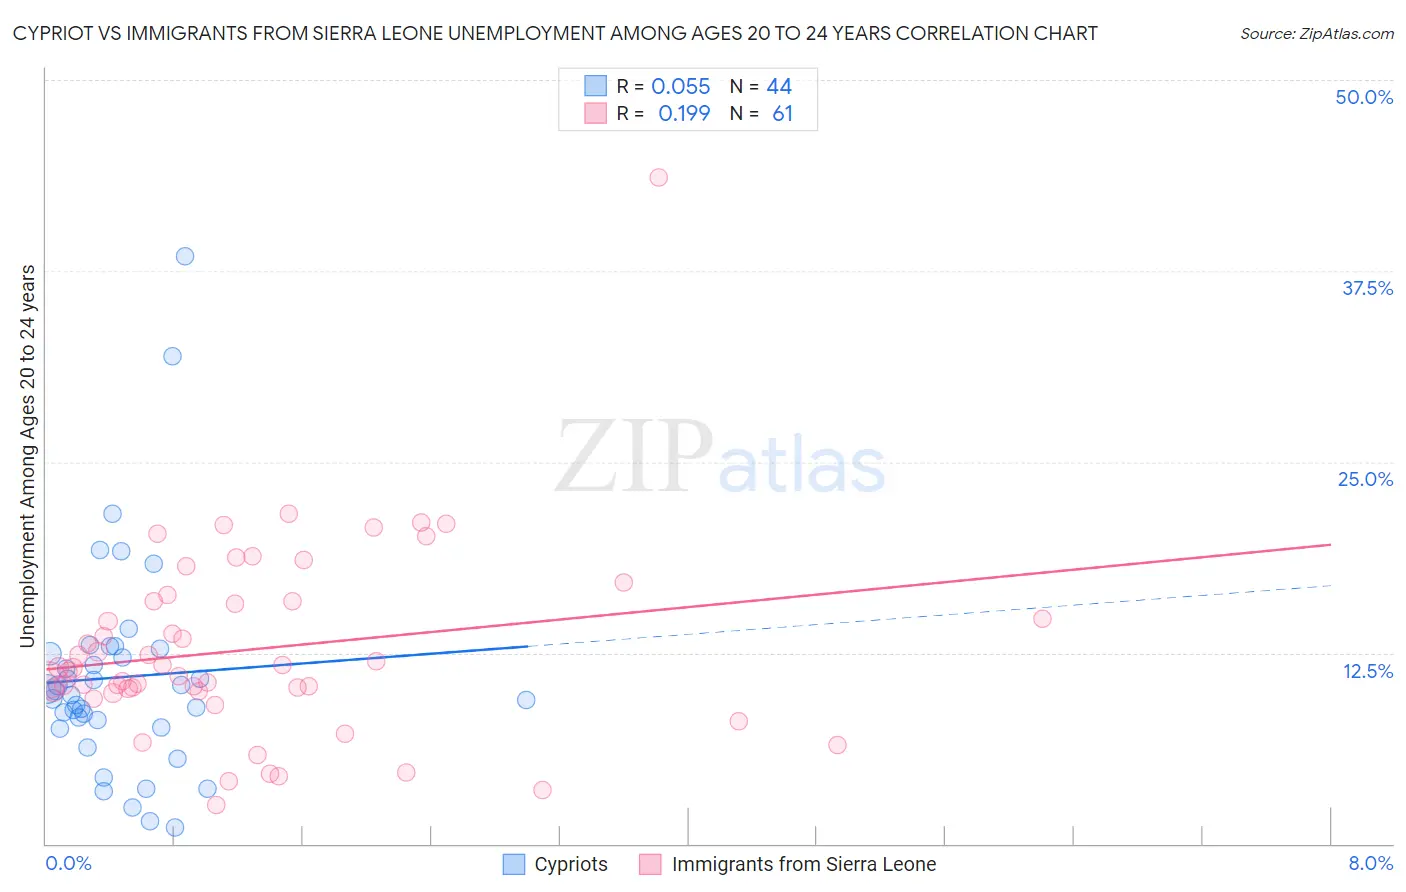
Cypriot vs Immigrants from Sierra Leone Unemployment Among Ages 20 to 24 years Correlation Chart

The statistical analysis conducted on geographies consisting of 61,203,816 people shows a slight positive correlation between the proportion of Cypriots and unemployment rate among population between the ages 20 and 24 in the United States with a correlation coefficient (R) of 0.055 and weighted average of 10.4%. Similarly, the statistical analysis conducted on geographies consisting of 101,003,153 people shows a poor positive correlation between the proportion of Immigrants from Sierra Leone and unemployment rate among population between the ages 20 and 24 in the United States with a correlation coefficient (R) of 0.199 and weighted average of 12.1%, a difference of 16.0%.
Cypriot vs Immigrants from Sierra Leone Unemployment Among Ages 20 to 24 years

Unemployment Among Ages 20 to 24 years Correlation Summary

MeasurementCypriotImmigrants from Sierra Leone
Minimum1.1%2.5%
Maximum38.5%43.6%
Range37.4%41.1%
Mean10.9%12.7%
Median9.9%11.5%
Interquartile 25% (IQ1)7.9%10.0%
Interquartile 75% (IQ3)12.6%15.9%
Interquartile Range (IQR)4.8%5.9%
Standard Deviation (Sample)7.0%6.3%
Standard Deviation (Population)6.9%6.2%

Similar Demographics by Unemployment Among Ages 20 to 24 years

Demographics Similar to Cypriots by Unemployment Among Ages 20 to 24 years

In terms of unemployment among ages 20 to 24 years, the demographic groups most similar to Cypriots are Immigrants from Europe (10.4%, a difference of 0.030%), Immigrants from Northern Europe (10.4%, a difference of 0.040%), Immigrants from Honduras (10.4%, a difference of 0.060%), Immigrants from Hong Kong (10.5%, a difference of 0.080%), and South American (10.4%, a difference of 0.090%).
DemographicsRating | RankUnemployment Among Ages 20 to 24 years
Colombians
22.3
/100
|
#198
Fair
10.4%
Portuguese
21.8
/100
|
#199
Fair
10.4%
Russians
21.2
/100
|
#200
Fair
10.4%
Immigrants | Peru
21.2
/100
|
#201
Fair
10.4%
Immigrants | Middle Africa
20.9
/100
|
#202
Fair
10.4%
South Americans
20.6
/100
|
#203
Fair
10.4%
Immigrants | Northern Europe
19.5
/100
|
#204
Poor
10.4%
Cypriots
18.9
/100
|
#205
Poor
10.4%
Immigrants | Europe
18.5
/100
|
#206
Poor
10.4%
Immigrants | Honduras
17.9
/100
|
#207
Poor
10.4%
Immigrants | Hong Kong
17.6
/100
|
#208
Poor
10.5%
Peruvians
17.2
/100
|
#209
Poor
10.5%
Immigrants | Belgium
16.9
/100
|
#210
Poor
10.5%
Immigrants | Guatemala
14.6
/100
|
#211
Poor
10.5%
Immigrants | Sri Lanka
14.0
/100
|
#212
Poor
10.5%

Demographics Similar to Immigrants from Sierra Leone by Unemployment Among Ages 20 to 24 years

In terms of unemployment among ages 20 to 24 years, the demographic groups most similar to Immigrants from Sierra Leone are Spanish American Indian (12.1%, a difference of 0.49%), Apache (12.0%, a difference of 0.64%), Lumbee (12.0%, a difference of 0.67%), Immigrants from Cabo Verde (12.2%, a difference of 0.85%), and Haitian (12.2%, a difference of 0.87%).
DemographicsRating | RankUnemployment Among Ages 20 to 24 years
Immigrants | Belize
0.0
/100
|
#294
Tragic
12.0%
Immigrants | Armenia
0.0
/100
|
#295
Tragic
12.0%
Cajuns
0.0
/100
|
#296
Tragic
12.0%
Blackfeet
0.0
/100
|
#297
Tragic
12.0%
Lumbee
0.0
/100
|
#298
Tragic
12.0%
Apache
0.0
/100
|
#299
Tragic
12.0%
Spanish American Indians
0.0
/100
|
#300
Tragic
12.1%
Immigrants | Sierra Leone
0.0
/100
|
#301
Tragic
12.1%
Immigrants | Cabo Verde
0.0
/100
|
#302
Tragic
12.2%
Haitians
0.0
/100
|
#303
Tragic
12.2%
Immigrants | West Indies
0.0
/100
|
#304
Tragic
12.3%
Chippewa
0.0
/100
|
#305
Tragic
12.3%
Immigrants | Haiti
0.0
/100
|
#306
Tragic
12.4%
Bermudans
0.0
/100
|
#307
Tragic
12.5%
Tohono O'odham
0.0
/100
|
#308
Tragic
12.5%