Crow vs Nicaraguan Unemployment Among Women with Children Under 18 years
COMPARE
Crow
Nicaraguan
Unemployment Among Women with Children Under 18 years
Unemployment Among Women with Children Under 18 years Comparison
Crow
Nicaraguans
8.2%
UNEMPLOYMENT AMONG WOMEN WITH CHILDREN UNDER 18 YEARS
0.0/ 100
METRIC RATING
340th/ 347
METRIC RANK
5.6%
UNEMPLOYMENT AMONG WOMEN WITH CHILDREN UNDER 18 YEARS
12.3/ 100
METRIC RATING
206th/ 347
METRIC RANK
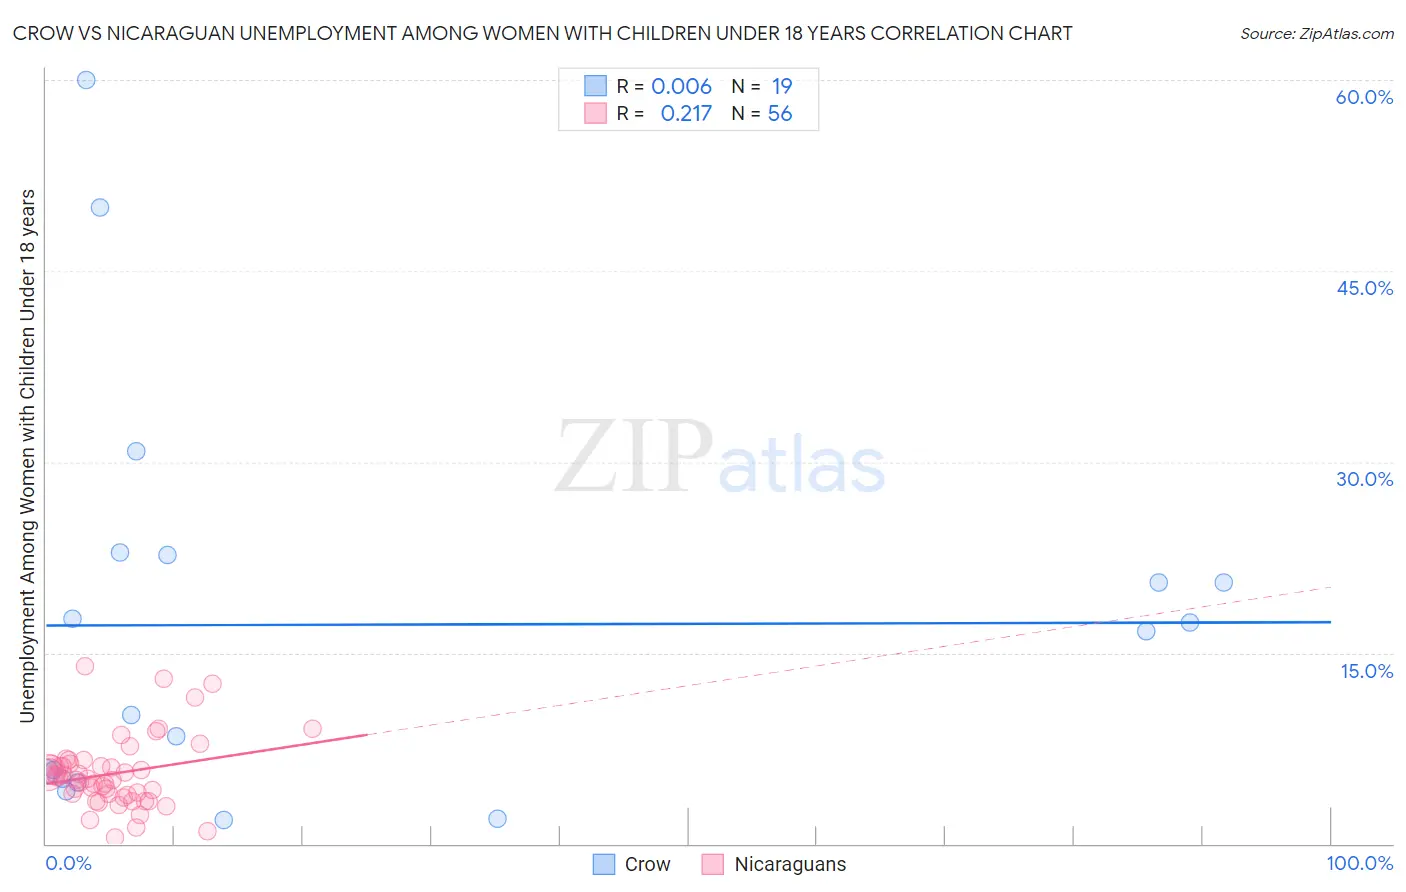
Crow vs Nicaraguan Unemployment Among Women with Children Under 18 years Correlation Chart
The statistical analysis conducted on geographies consisting of 58,293,052 people shows no correlation between the proportion of Crow and unemployment rate among women with children under the age of 18 in the United States with a correlation coefficient (R) of 0.006 and weighted average of 8.2%. Similarly, the statistical analysis conducted on geographies consisting of 280,093,302 people shows a weak positive correlation between the proportion of Nicaraguans and unemployment rate among women with children under the age of 18 in the United States with a correlation coefficient (R) of 0.217 and weighted average of 5.6%, a difference of 46.3%.
Unemployment Among Women with Children Under 18 years Correlation Summary
| Measurement | Crow | Nicaraguan |
| Minimum | 1.9% | 0.50% |
| Maximum | 60.0% | 14.0% |
| Range | 58.1% | 13.5% |
| Mean | 17.2% | 5.5% |
| Median | 16.7% | 5.2% |
| Interquartile 25% (IQ1) | 5.1% | 3.9% |
| Interquartile 75% (IQ3) | 22.7% | 6.2% |
| Interquartile Range (IQR) | 17.6% | 2.4% |
| Standard Deviation (Sample) | 15.8% | 2.8% |
| Standard Deviation (Population) | 15.4% | 2.7% |
Similar Demographics by Unemployment Among Women with Children Under 18 years
Demographics Similar to Crow by Unemployment Among Women with Children Under 18 years
In terms of unemployment among women with children under 18 years, the demographic groups most similar to Crow are Navajo (8.2%, a difference of 0.20%), Immigrants from Yemen (8.2%, a difference of 0.72%), Yakama (8.1%, a difference of 2.3%), Sioux (7.9%, a difference of 3.8%), and Apache (7.9%, a difference of 4.1%).
| Demographics | Rating | Rank | Unemployment Among Women with Children Under 18 years |
| Immigrants | Dominican Republic | 0.0 /100 | #333 | Tragic 7.5% |
| Cheyenne | 0.0 /100 | #334 | Tragic 7.8% |
| Apache | 0.0 /100 | #335 | Tragic 7.9% |
| Sioux | 0.0 /100 | #336 | Tragic 7.9% |
| Yakama | 0.0 /100 | #337 | Tragic 8.1% |
| Immigrants | Yemen | 0.0 /100 | #338 | Tragic 8.2% |
| Navajo | 0.0 /100 | #339 | Tragic 8.2% |
| Crow | 0.0 /100 | #340 | Tragic 8.2% |
| Tohono O'odham | 0.0 /100 | #341 | Tragic 8.9% |
| Puerto Ricans | 0.0 /100 | #342 | Tragic 9.0% |
| Arapaho | 0.0 /100 | #343 | Tragic 9.2% |
| Inupiat | 0.0 /100 | #344 | Tragic 9.6% |
| Yuman | 0.0 /100 | #345 | Tragic 9.8% |
| Yup'ik | 0.0 /100 | #346 | Tragic 11.0% |
| Pima | 0.0 /100 | #347 | Tragic 11.7% |
Demographics Similar to Nicaraguans by Unemployment Among Women with Children Under 18 years
In terms of unemployment among women with children under 18 years, the demographic groups most similar to Nicaraguans are Peruvian (5.6%, a difference of 0.040%), Immigrants from Costa Rica (5.6%, a difference of 0.12%), Immigrants from Western Asia (5.6%, a difference of 0.18%), Nonimmigrants (5.7%, a difference of 0.29%), and Panamanian (5.7%, a difference of 0.39%).
| Demographics | Rating | Rank | Unemployment Among Women with Children Under 18 years |
| Marshallese | 20.2 /100 | #199 | Fair 5.6% |
| Menominee | 18.6 /100 | #200 | Poor 5.6% |
| Immigrants | Morocco | 17.9 /100 | #201 | Poor 5.6% |
| Immigrants | Micronesia | 17.1 /100 | #202 | Poor 5.6% |
| Portuguese | 15.9 /100 | #203 | Poor 5.6% |
| Israelis | 15.6 /100 | #204 | Poor 5.6% |
| Tsimshian | 15.2 /100 | #205 | Poor 5.6% |
| Nicaraguans | 12.3 /100 | #206 | Poor 5.6% |
| Peruvians | 12.1 /100 | #207 | Poor 5.6% |
| Immigrants | Costa Rica | 11.6 /100 | #208 | Poor 5.6% |
| Immigrants | Western Asia | 11.3 /100 | #209 | Poor 5.6% |
| Immigrants | Nonimmigrants | 10.6 /100 | #210 | Poor 5.7% |
| Panamanians | 10.1 /100 | #211 | Poor 5.7% |
| South Americans | 10.0 /100 | #212 | Poor 5.7% |
| Americans | 8.9 /100 | #213 | Tragic 5.7% |