Crow vs Immigrants from Ukraine Unemployment Among Ages 45 to 54 years
COMPARE
Crow
Immigrants from Ukraine
Unemployment Among Ages 45 to 54 years
Unemployment Among Ages 45 to 54 years Comparison
Crow
Immigrants from Ukraine
13.7%
UNEMPLOYMENT AMONG AGES 45 TO 54 YEARS
0.0/ 100
METRIC RATING
347th/ 347
METRIC RANK
4.5%
UNEMPLOYMENT AMONG AGES 45 TO 54 YEARS
36.8/ 100
METRIC RATING
187th/ 347
METRIC RANK
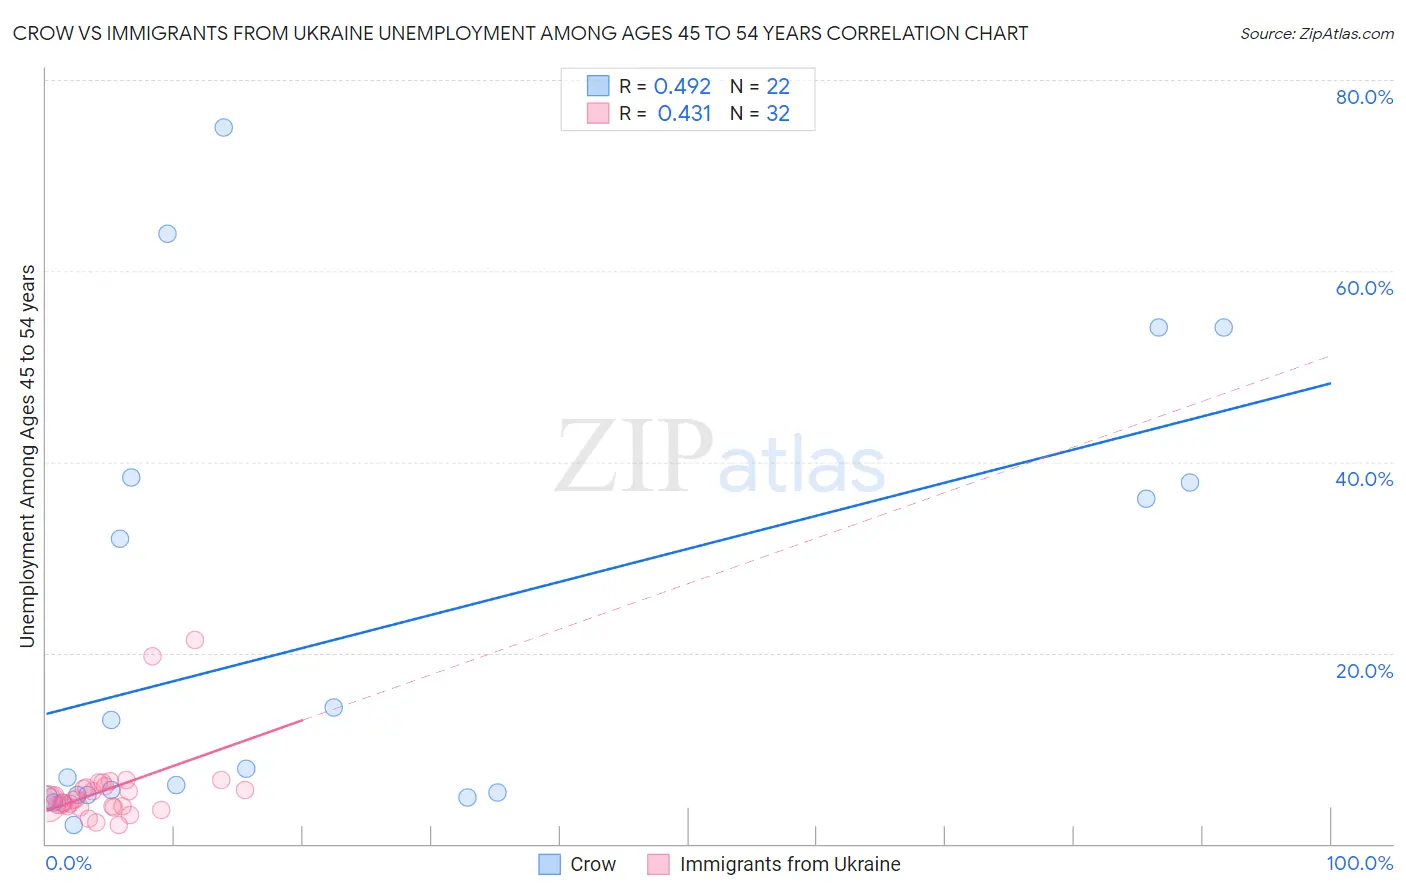
Crow vs Immigrants from Ukraine Unemployment Among Ages 45 to 54 years Correlation Chart
The statistical analysis conducted on geographies consisting of 58,625,071 people shows a moderate positive correlation between the proportion of Crow and unemployment rate among population between the ages 45 and 54 in the United States with a correlation coefficient (R) of 0.492 and weighted average of 13.7%. Similarly, the statistical analysis conducted on geographies consisting of 284,276,197 people shows a moderate positive correlation between the proportion of Immigrants from Ukraine and unemployment rate among population between the ages 45 and 54 in the United States with a correlation coefficient (R) of 0.431 and weighted average of 4.5%, a difference of 202.1%.
Unemployment Among Ages 45 to 54 years Correlation Summary
| Measurement | Crow | Immigrants from Ukraine |
| Minimum | 1.9% | 2.0% |
| Maximum | 75.0% | 21.3% |
| Range | 73.1% | 19.3% |
| Mean | 21.9% | 5.6% |
| Median | 7.4% | 4.6% |
| Interquartile 25% (IQ1) | 5.0% | 3.9% |
| Interquartile 75% (IQ3) | 37.8% | 5.9% |
| Interquartile Range (IQR) | 32.8% | 2.0% |
| Standard Deviation (Sample) | 22.9% | 4.1% |
| Standard Deviation (Population) | 22.4% | 4.0% |
Similar Demographics by Unemployment Among Ages 45 to 54 years
Demographics Similar to Crow by Unemployment Among Ages 45 to 54 years
In terms of unemployment among ages 45 to 54 years, the demographic groups most similar to Crow are Yup'ik (11.9%, a difference of 15.7%), Cheyenne (10.6%, a difference of 30.1%), Yuman (9.5%, a difference of 44.8%), Inupiat (9.2%, a difference of 49.6%), and Alaskan Athabascan (8.5%, a difference of 62.4%).
| Demographics | Rating | Rank | Unemployment Among Ages 45 to 54 years |
| Immigrants | Yemen | 0.0 /100 | #333 | Tragic 6.5% |
| Sioux | 0.0 /100 | #334 | Tragic 6.6% |
| Navajo | 0.0 /100 | #335 | Tragic 6.7% |
| Puerto Ricans | 0.0 /100 | #336 | Tragic 6.8% |
| Apache | 0.0 /100 | #337 | Tragic 7.0% |
| Colville | 0.0 /100 | #338 | Tragic 7.4% |
| Arapaho | 0.0 /100 | #339 | Tragic 7.5% |
| Hopi | 0.0 /100 | #340 | Tragic 7.5% |
| Paiute | 0.0 /100 | #341 | Tragic 7.8% |
| Alaskan Athabascans | 0.0 /100 | #342 | Tragic 8.5% |
| Inupiat | 0.0 /100 | #343 | Tragic 9.2% |
| Yuman | 0.0 /100 | #344 | Tragic 9.5% |
| Cheyenne | 0.0 /100 | #345 | Tragic 10.6% |
| Yup'ik | 0.0 /100 | #346 | Tragic 11.9% |
| Crow | 0.0 /100 | #347 | Tragic 13.7% |
Demographics Similar to Immigrants from Ukraine by Unemployment Among Ages 45 to 54 years
In terms of unemployment among ages 45 to 54 years, the demographic groups most similar to Immigrants from Ukraine are Immigrants from Sierra Leone (4.6%, a difference of 0.030%), Immigrants from Laos (4.6%, a difference of 0.060%), Immigrants from Serbia (4.6%, a difference of 0.10%), Hawaiian (4.5%, a difference of 0.11%), and Immigrants from Uruguay (4.6%, a difference of 0.13%).
| Demographics | Rating | Rank | Unemployment Among Ages 45 to 54 years |
| Malaysians | 47.5 /100 | #180 | Average 4.5% |
| Immigrants | Poland | 47.0 /100 | #181 | Average 4.5% |
| Immigrants | China | 46.7 /100 | #182 | Average 4.5% |
| Sierra Leoneans | 46.7 /100 | #183 | Average 4.5% |
| Immigrants | Hong Kong | 45.9 /100 | #184 | Average 4.5% |
| Immigrants | Philippines | 41.0 /100 | #185 | Average 4.5% |
| Hawaiians | 39.1 /100 | #186 | Fair 4.5% |
| Immigrants | Ukraine | 36.8 /100 | #187 | Fair 4.5% |
| Immigrants | Sierra Leone | 36.3 /100 | #188 | Fair 4.6% |
| Immigrants | Laos | 35.7 /100 | #189 | Fair 4.6% |
| Immigrants | Serbia | 34.8 /100 | #190 | Fair 4.6% |
| Immigrants | Uruguay | 34.4 /100 | #191 | Fair 4.6% |
| Immigrants | Thailand | 34.1 /100 | #192 | Fair 4.6% |
| Immigrants | Lithuania | 33.2 /100 | #193 | Fair 4.6% |
| South Americans | 32.9 /100 | #194 | Fair 4.6% |