Creek vs Ukrainian Unemployment Among Ages 30 to 34 years
COMPARE
Creek
Ukrainian
Unemployment Among Ages 30 to 34 years
Unemployment Among Ages 30 to 34 years Comparison
Creek
Ukrainians
6.6%
UNEMPLOYMENT AMONG AGES 30 TO 34 YEARS
0.0/ 100
METRIC RATING
297th/ 347
METRIC RANK
5.4%
UNEMPLOYMENT AMONG AGES 30 TO 34 YEARS
69.2/ 100
METRIC RATING
147th/ 347
METRIC RANK
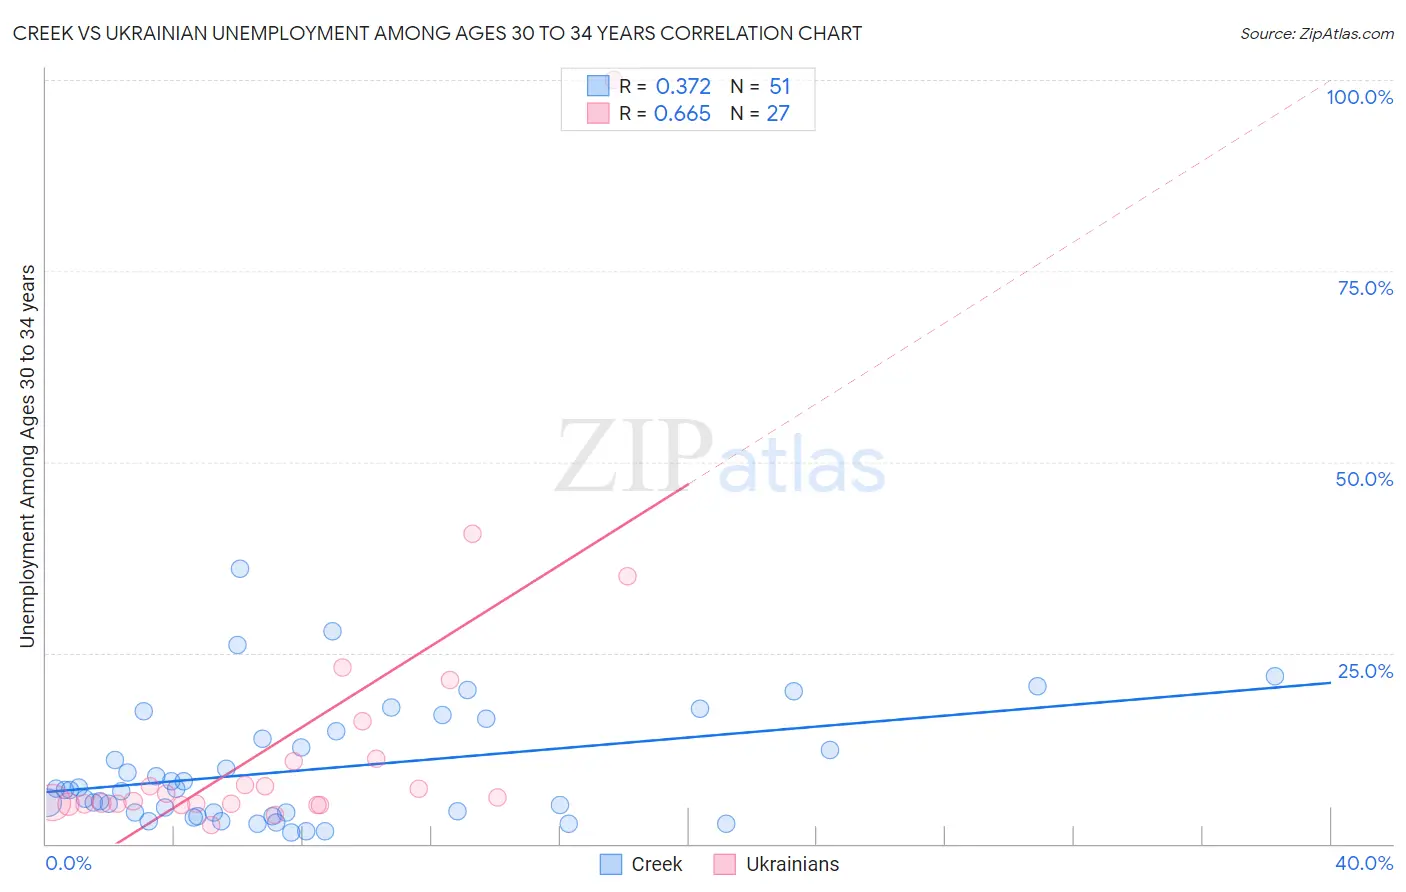
Creek vs Ukrainian Unemployment Among Ages 30 to 34 years Correlation Chart
The statistical analysis conducted on geographies consisting of 172,153,773 people shows a mild positive correlation between the proportion of Creek and unemployment rate among population between the ages 30 and 34 in the United States with a correlation coefficient (R) of 0.372 and weighted average of 6.6%. Similarly, the statistical analysis conducted on geographies consisting of 412,531,563 people shows a significant positive correlation between the proportion of Ukrainians and unemployment rate among population between the ages 30 and 34 in the United States with a correlation coefficient (R) of 0.665 and weighted average of 5.4%, a difference of 21.7%.
Unemployment Among Ages 30 to 34 years Correlation Summary
| Measurement | Creek | Ukrainian |
| Minimum | 1.5% | 2.5% |
| Maximum | 36.0% | 100.0% |
| Range | 34.5% | 97.5% |
| Mean | 9.7% | 13.5% |
| Median | 7.0% | 6.1% |
| Interquartile 25% (IQ1) | 4.1% | 5.2% |
| Interquartile 75% (IQ3) | 14.7% | 11.1% |
| Interquartile Range (IQR) | 10.6% | 5.9% |
| Standard Deviation (Sample) | 7.8% | 19.7% |
| Standard Deviation (Population) | 7.7% | 19.3% |
Similar Demographics by Unemployment Among Ages 30 to 34 years
Demographics Similar to Creek by Unemployment Among Ages 30 to 34 years
In terms of unemployment among ages 30 to 34 years, the demographic groups most similar to Creek are Immigrants from Jamaica (6.5%, a difference of 0.10%), Trinidadian and Tobagonian (6.5%, a difference of 0.15%), Immigrants from Barbados (6.6%, a difference of 0.25%), Dutch West Indian (6.6%, a difference of 0.35%), and Barbadian (6.5%, a difference of 0.39%).
| Demographics | Rating | Rank | Unemployment Among Ages 30 to 34 years |
| Immigrants | Trinidad and Tobago | 0.0 /100 | #290 | Tragic 6.5% |
| Jamaicans | 0.0 /100 | #291 | Tragic 6.5% |
| Vietnamese | 0.0 /100 | #292 | Tragic 6.5% |
| West Indians | 0.0 /100 | #293 | Tragic 6.5% |
| Barbadians | 0.0 /100 | #294 | Tragic 6.5% |
| Trinidadians and Tobagonians | 0.0 /100 | #295 | Tragic 6.5% |
| Immigrants | Jamaica | 0.0 /100 | #296 | Tragic 6.5% |
| Creek | 0.0 /100 | #297 | Tragic 6.6% |
| Immigrants | Barbados | 0.0 /100 | #298 | Tragic 6.6% |
| Dutch West Indians | 0.0 /100 | #299 | Tragic 6.6% |
| Bahamians | 0.0 /100 | #300 | Tragic 6.6% |
| Belizeans | 0.0 /100 | #301 | Tragic 6.6% |
| Delaware | 0.0 /100 | #302 | Tragic 6.7% |
| Cajuns | 0.0 /100 | #303 | Tragic 6.7% |
| Kiowa | 0.0 /100 | #304 | Tragic 6.7% |
Demographics Similar to Ukrainians by Unemployment Among Ages 30 to 34 years
In terms of unemployment among ages 30 to 34 years, the demographic groups most similar to Ukrainians are Immigrants from Iran (5.4%, a difference of 0.010%), Immigrants from Colombia (5.4%, a difference of 0.030%), Colombian (5.4%, a difference of 0.040%), Celtic (5.4%, a difference of 0.080%), and Syrian (5.4%, a difference of 0.090%).
| Demographics | Rating | Rank | Unemployment Among Ages 30 to 34 years |
| Immigrants | North America | 72.2 /100 | #140 | Good 5.4% |
| Immigrants | Europe | 72.1 /100 | #141 | Good 5.4% |
| Immigrants | Greece | 72.0 /100 | #142 | Good 5.4% |
| Russians | 71.1 /100 | #143 | Good 5.4% |
| Immigrants | Russia | 71.0 /100 | #144 | Good 5.4% |
| Syrians | 70.3 /100 | #145 | Good 5.4% |
| Celtics | 70.2 /100 | #146 | Good 5.4% |
| Ukrainians | 69.2 /100 | #147 | Good 5.4% |
| Immigrants | Iran | 69.1 /100 | #148 | Good 5.4% |
| Immigrants | Colombia | 68.9 /100 | #149 | Good 5.4% |
| Colombians | 68.7 /100 | #150 | Good 5.4% |
| Immigrants | Oceania | 68.1 /100 | #151 | Good 5.4% |
| Lebanese | 67.2 /100 | #152 | Good 5.4% |
| Immigrants | South Eastern Asia | 66.5 /100 | #153 | Good 5.4% |
| South Africans | 66.5 /100 | #154 | Good 5.4% |