Creek vs Nigerian Unemployment Among Youth under 25 years
COMPARE
Creek
Nigerian
Unemployment Among Youth under 25 years
Unemployment Among Youth under 25 years Comparison
Creek
Nigerians
11.2%
UNEMPLOYMENT AMONG YOUTH UNDER 25 YEARS
97.2/ 100
METRIC RATING
73rd/ 347
METRIC RANK
13.0%
UNEMPLOYMENT AMONG YOUTH UNDER 25 YEARS
0.0/ 100
METRIC RATING
273rd/ 347
METRIC RANK
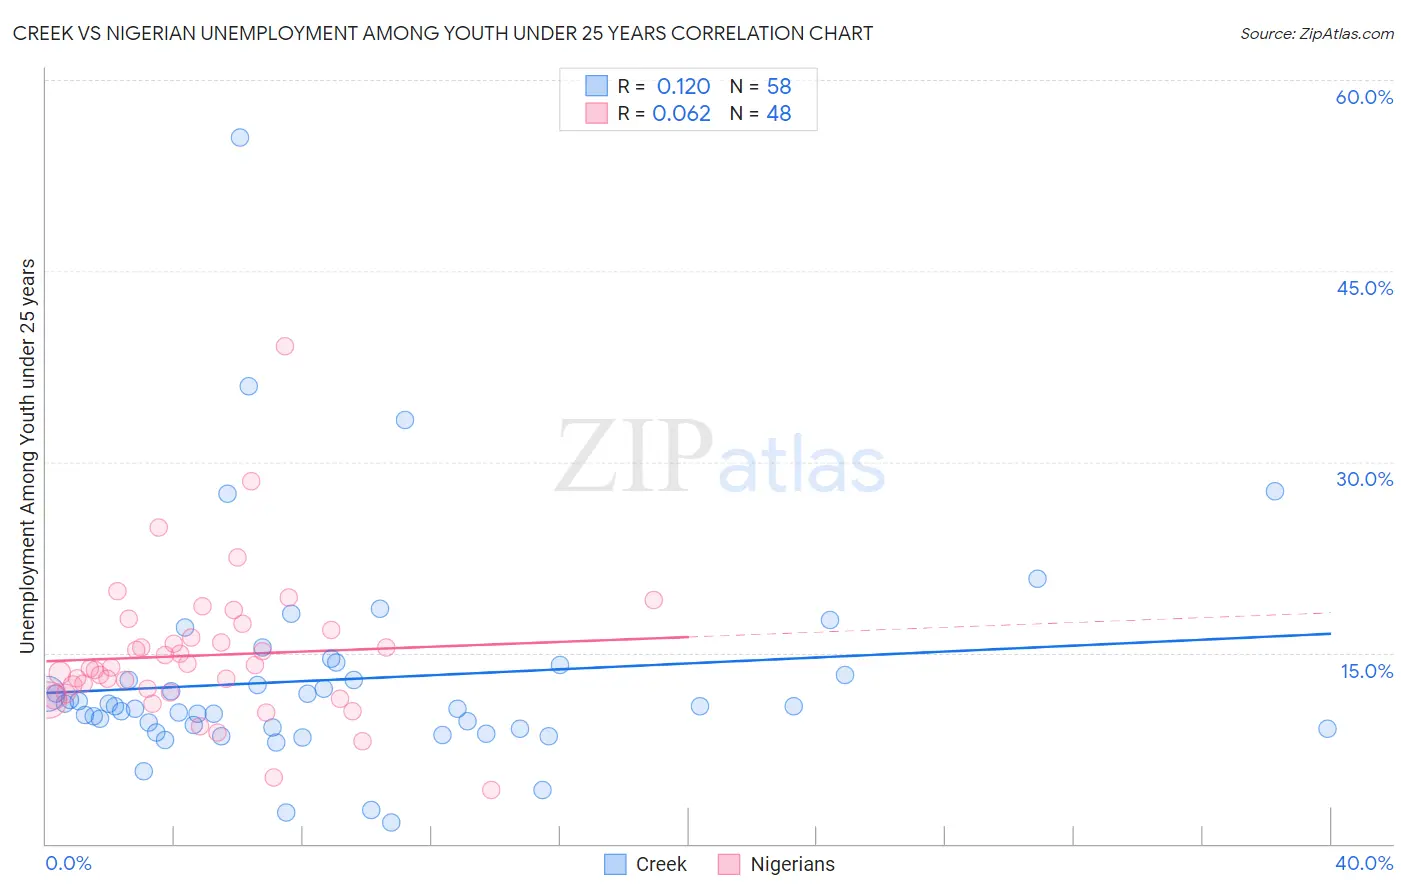
Creek vs Nigerian Unemployment Among Youth under 25 years Correlation Chart
The statistical analysis conducted on geographies consisting of 177,085,526 people shows a poor positive correlation between the proportion of Creek and unemployment rate among youth under the age of 25 in the United States with a correlation coefficient (R) of 0.120 and weighted average of 11.2%. Similarly, the statistical analysis conducted on geographies consisting of 330,774,668 people shows a slight positive correlation between the proportion of Nigerians and unemployment rate among youth under the age of 25 in the United States with a correlation coefficient (R) of 0.062 and weighted average of 13.0%, a difference of 15.9%.
Unemployment Among Youth under 25 years Correlation Summary
| Measurement | Creek | Nigerian |
| Minimum | 1.7% | 4.2% |
| Maximum | 55.5% | 39.1% |
| Range | 53.8% | 34.9% |
| Mean | 12.9% | 14.8% |
| Median | 10.8% | 13.8% |
| Interquartile 25% (IQ1) | 9.0% | 11.8% |
| Interquartile 75% (IQ3) | 13.3% | 16.5% |
| Interquartile Range (IQR) | 4.3% | 4.7% |
| Standard Deviation (Sample) | 8.6% | 5.7% |
| Standard Deviation (Population) | 8.5% | 5.6% |
Similar Demographics by Unemployment Among Youth under 25 years
Demographics Similar to Creek by Unemployment Among Youth under 25 years
In terms of unemployment among youth under 25 years, the demographic groups most similar to Creek are New Zealander (11.2%, a difference of 0.010%), French (11.2%, a difference of 0.040%), Immigrants from Australia (11.2%, a difference of 0.050%), German Russian (11.2%, a difference of 0.060%), and Bhutanese (11.2%, a difference of 0.090%).
| Demographics | Rating | Rank | Unemployment Among Youth under 25 years |
| Macedonians | 97.7 /100 | #66 | Exceptional 11.2% |
| Chickasaw | 97.7 /100 | #67 | Exceptional 11.2% |
| Immigrants | Kenya | 97.6 /100 | #68 | Exceptional 11.2% |
| Immigrants | Moldova | 97.5 /100 | #69 | Exceptional 11.2% |
| Slavs | 97.5 /100 | #70 | Exceptional 11.2% |
| Bhutanese | 97.4 /100 | #71 | Exceptional 11.2% |
| Immigrants | Australia | 97.3 /100 | #72 | Exceptional 11.2% |
| Creek | 97.2 /100 | #73 | Exceptional 11.2% |
| New Zealanders | 97.2 /100 | #74 | Exceptional 11.2% |
| French | 97.1 /100 | #75 | Exceptional 11.2% |
| German Russians | 97.0 /100 | #76 | Exceptional 11.2% |
| Whites/Caucasians | 96.9 /100 | #77 | Exceptional 11.2% |
| Immigrants | Nicaragua | 96.7 /100 | #78 | Exceptional 11.2% |
| Immigrants | Canada | 96.7 /100 | #79 | Exceptional 11.2% |
| Immigrants | Bulgaria | 96.4 /100 | #80 | Exceptional 11.2% |
Demographics Similar to Nigerians by Unemployment Among Youth under 25 years
In terms of unemployment among youth under 25 years, the demographic groups most similar to Nigerians are Cape Verdean (12.9%, a difference of 0.35%), Immigrants from Bahamas (12.9%, a difference of 0.57%), Immigrants from Nigeria (13.0%, a difference of 0.58%), Bermudan (13.0%, a difference of 0.69%), and Immigrants from Liberia (12.8%, a difference of 1.1%).
| Demographics | Rating | Rank | Unemployment Among Youth under 25 years |
| Immigrants | Latin America | 0.0 /100 | #266 | Tragic 12.6% |
| Sub-Saharan Africans | 0.0 /100 | #267 | Tragic 12.6% |
| Tlingit-Haida | 0.0 /100 | #268 | Tragic 12.7% |
| Kiowa | 0.0 /100 | #269 | Tragic 12.7% |
| Immigrants | Liberia | 0.0 /100 | #270 | Tragic 12.8% |
| Immigrants | Bahamas | 0.0 /100 | #271 | Tragic 12.9% |
| Cape Verdeans | 0.0 /100 | #272 | Tragic 12.9% |
| Nigerians | 0.0 /100 | #273 | Tragic 13.0% |
| Immigrants | Nigeria | 0.0 /100 | #274 | Tragic 13.0% |
| Bermudans | 0.0 /100 | #275 | Tragic 13.0% |
| Immigrants | Uzbekistan | 0.0 /100 | #276 | Tragic 13.1% |
| Bahamians | 0.0 /100 | #277 | Tragic 13.1% |
| Africans | 0.0 /100 | #278 | Tragic 13.2% |
| Cajuns | 0.0 /100 | #279 | Tragic 13.2% |
| Ute | 0.0 /100 | #280 | Tragic 13.3% |