Creek vs Maltese Unemployment Among Ages 60 to 64 years

COMPARE

Creek
Race
Ancestry
AfghanAfricanAlaska NativeAlaskan AthabascanAlbanianAleutAlsatianAmericanApacheArabArapahoArgentineanArmenianAssyrian/Chaldean/SyriacAustralianAustrianBahamianBangladeshiBarbadianBasqueBelgianBelizeanBermudanBhutaneseBlackfeetBolivianBrazilianBritishBritish West IndianBulgarianBurmeseCajunCambodianCanadianCape VerdeanCarpatho RusynCelticCentral AmericanCentral American IndianCherokeeCheyenneChickasawChileanChineseChippewaChoctawColombianColvilleComancheCosta RicanCreeCreekCroatianCrowCubanCypriotCzechCzechoslovakianDanishDelawareDominicanDutchDutch West IndianEastern EuropeanEcuadorianEgyptianEnglishEstonianEthiopianEuropeanFijianFilipinoFinnishFrenchFrench American IndianFrench CanadianGermanGerman RussianGhanaianGreekGuamanian/ChamorroGuatemalanGuyaneseHaitianHmongHonduranHopiHoumaHungarianIcelanderIndian (Asian)IndonesianInupiatIranianIraqiIrishIroquoisIsraeliItalianJamaicanJapaneseJordanianKenyanKiowaKoreanLaotianLatvianLebaneseLiberianLithuanianLumbeeLuxembourgerMacedonianMalaysianMarshalleseMenomineeMexicanMexican American IndianMongolianMoroccanNative HawaiianNavajoNepaleseNew ZealanderNicaraguanNigerianNorthern EuropeanNorwegianOkinawanOsageOttawaPaiutePakistaniPalestinianPanamanianParaguayanPennsylvania GermanPeruvianPimaPolishPortuguesePotawatomiPuebloPuerto RicanPuget Sound SalishRomanianRussianSalvadoranSamoanScandinavianScotch-IrishScottishSeminoleSenegaleseSerbianShoshoneSierra LeoneanSiouxSlavicSlovakSloveneSomaliSouth AfricanSouth AmericanSouth American IndianSoviet UnionSpaniardSpanishSpanish AmericanSpanish American IndianSri LankanSubsaharan AfricanSudaneseSwedishSwissSyrianTaiwaneseThaiTlingit-HaidaTohono O'OdhamTonganTrinidadian and TobagonianTsimshianTurkishU.S. Virgin IslanderUgandanUkrainianUruguayanUteVenezuelanVietnameseWelshWest IndianYakamaYaquiYugoslavianYumanYup'ikZimbabwean
Immigration
NonimmigrantsImmigrantsAfghanistanAfricaAlbaniaArgentinaArmeniaAsiaAustraliaAustriaBahamasBangladeshBarbadosBelarusBelgiumBelizeBoliviaBosnia and HerzegovinaBrazilBulgariaBurma/MyanmarCabo VerdeCambodiaCameroonCanadaCaribbeanCentral AmericaChileChinaColombiaCongoCosta RicaCroatiaCubaCzechoslovakiaDenmarkDominicaDominican RepublicEastern AfricaEastern AsiaEastern EuropeEcuadorEgyptEl SalvadorEnglandEritreaEthiopiaEuropeFijiFranceGermanyGhanaGreeceGrenadaGuatemalaGuyanaHaitiHondurasHong KongHungaryIndiaIndonesiaIranIraqIrelandIsraelItalyJamaicaJapanJordanKazakhstanKenyaKoreaKuwaitLaosLatin AmericaLatviaLebanonLiberiaLithuaniaMalaysiaMexicoMicronesiaMiddle AfricaMoldovaMoroccoNepalNetherlandsNicaraguaNigeriaNorth AmericaNorth MacedoniaNorthern AfricaNorthern EuropeNorwayOceaniaPakistanPanamaPeruPhilippinesPolandPortugalRomaniaRussiaSaudi ArabiaScotlandSenegalSerbiaSierra LeoneSingaporeSomaliaSouth AfricaSouth AmericaSouth Central AsiaSouth Eastern AsiaSouthern EuropeSpainSri LankaSt. Vincent and the GrenadinesSudanSwedenSwitzerlandSyriaTaiwanThailandTrinidad and TobagoTurkeyUgandaUkraineUruguayUzbekistanVenezuelaVietnamWest IndiesWestern AfricaWestern AsiaWestern EuropeYemenZaireZimbabweAzores
Maltese
Race
Ancestry
AfghanAfricanAlaska NativeAlaskan AthabascanAlbanianAleutAlsatianAmericanApacheArabArapahoArgentineanArmenianAssyrian/Chaldean/SyriacAustralianAustrianBahamianBangladeshiBarbadianBasqueBelgianBelizeanBermudanBhutaneseBlackfeetBolivianBrazilianBritishBritish West IndianBulgarianBurmeseCajunCambodianCanadianCape VerdeanCarpatho RusynCelticCentral AmericanCentral American IndianCherokeeCheyenneChickasawChileanChineseChippewaChoctawColombianColvilleComancheCosta RicanCreeCroatianCrowCubanCypriotCzechCzechoslovakianDanishDelawareDominicanDutchDutch West IndianEastern EuropeanEcuadorianEgyptianEnglishEstonianEthiopianEuropeanFijianFilipinoFinnishFrenchFrench American IndianFrench CanadianGermanGerman RussianGhanaianGreekGuamanian/ChamorroGuatemalanGuyaneseHaitianHmongHonduranHopiHoumaHungarianIcelanderIndian (Asian)IndonesianInupiatIranianIraqiIrishIroquoisIsraeliItalianJamaicanJapaneseJordanianKenyanKiowaKoreanLaotianLatvianLebaneseLiberianLithuanianLumbeeLuxembourgerMacedonianMalaysianMalteseMarshalleseMenomineeMexicanMexican American IndianMongolianMoroccanNative HawaiianNavajoNepaleseNew ZealanderNicaraguanNigerianNorthern EuropeanNorwegianOkinawanOsageOttawaPaiutePakistaniPalestinianPanamanianParaguayanPennsylvania GermanPeruvianPimaPolishPortuguesePotawatomiPuebloPuerto RicanPuget Sound SalishRomanianRussianSalvadoranSamoanScandinavianScotch-IrishScottishSeminoleSenegaleseSerbianShoshoneSierra LeoneanSiouxSlavicSlovakSloveneSomaliSouth AfricanSouth AmericanSouth American IndianSoviet UnionSpaniardSpanishSpanish AmericanSpanish American IndianSri LankanSubsaharan AfricanSudaneseSwedishSwissSyrianTaiwaneseThaiTlingit-HaidaTohono O'OdhamTonganTrinidadian and TobagonianTsimshianTurkishU.S. Virgin IslanderUgandanUkrainianUruguayanUteVenezuelanVietnameseWelshWest IndianYakamaYaquiYugoslavianYumanYup'ikZimbabwean
Immigration
NonimmigrantsImmigrantsAfghanistanAfricaAlbaniaArgentinaArmeniaAsiaAustraliaAustriaBahamasBangladeshBarbadosBelarusBelgiumBelizeBoliviaBosnia and HerzegovinaBrazilBulgariaBurma/MyanmarCabo VerdeCambodiaCameroonCanadaCaribbeanCentral AmericaChileChinaColombiaCongoCosta RicaCroatiaCubaCzechoslovakiaDenmarkDominicaDominican RepublicEastern AfricaEastern AsiaEastern EuropeEcuadorEgyptEl SalvadorEnglandEritreaEthiopiaEuropeFijiFranceGermanyGhanaGreeceGrenadaGuatemalaGuyanaHaitiHondurasHong KongHungaryIndiaIndonesiaIranIraqIrelandIsraelItalyJamaicaJapanJordanKazakhstanKenyaKoreaKuwaitLaosLatin AmericaLatviaLebanonLiberiaLithuaniaMalaysiaMexicoMicronesiaMiddle AfricaMoldovaMoroccoNepalNetherlandsNicaraguaNigeriaNorth AmericaNorth MacedoniaNorthern AfricaNorthern EuropeNorwayOceaniaPakistanPanamaPeruPhilippinesPolandPortugalRomaniaRussiaSaudi ArabiaScotlandSenegalSerbiaSierra LeoneSingaporeSomaliaSouth AfricaSouth AmericaSouth Central AsiaSouth Eastern AsiaSouthern EuropeSpainSri LankaSt. Vincent and the GrenadinesSudanSwedenSwitzerlandSyriaTaiwanThailandTrinidad and TobagoTurkeyUgandaUkraineUruguayUzbekistanVenezuelaVietnamWest IndiesWestern AfricaWestern AsiaWestern EuropeYemenZaireZimbabweAzores
Unemployment Among Ages 60 to 64 years
Income
Poverty
Unemployment
Labor Participation
Family Structure
Vehicle Availability
Education Level
Disability

Unemployment Among Ages 60 to 64 years Comparison

Creek

Maltese

Exceptional
Exceptional
4.6%
UNEMPLOYMENT AMONG AGES 60 TO 64 YEARS
99.6/ 100
METRIC RATING
69th/ 347
METRIC RANK
4.7%
UNEMPLOYMENT AMONG AGES 60 TO 64 YEARS
96.5/ 100
METRIC RATING
114th/ 347
METRIC RANK

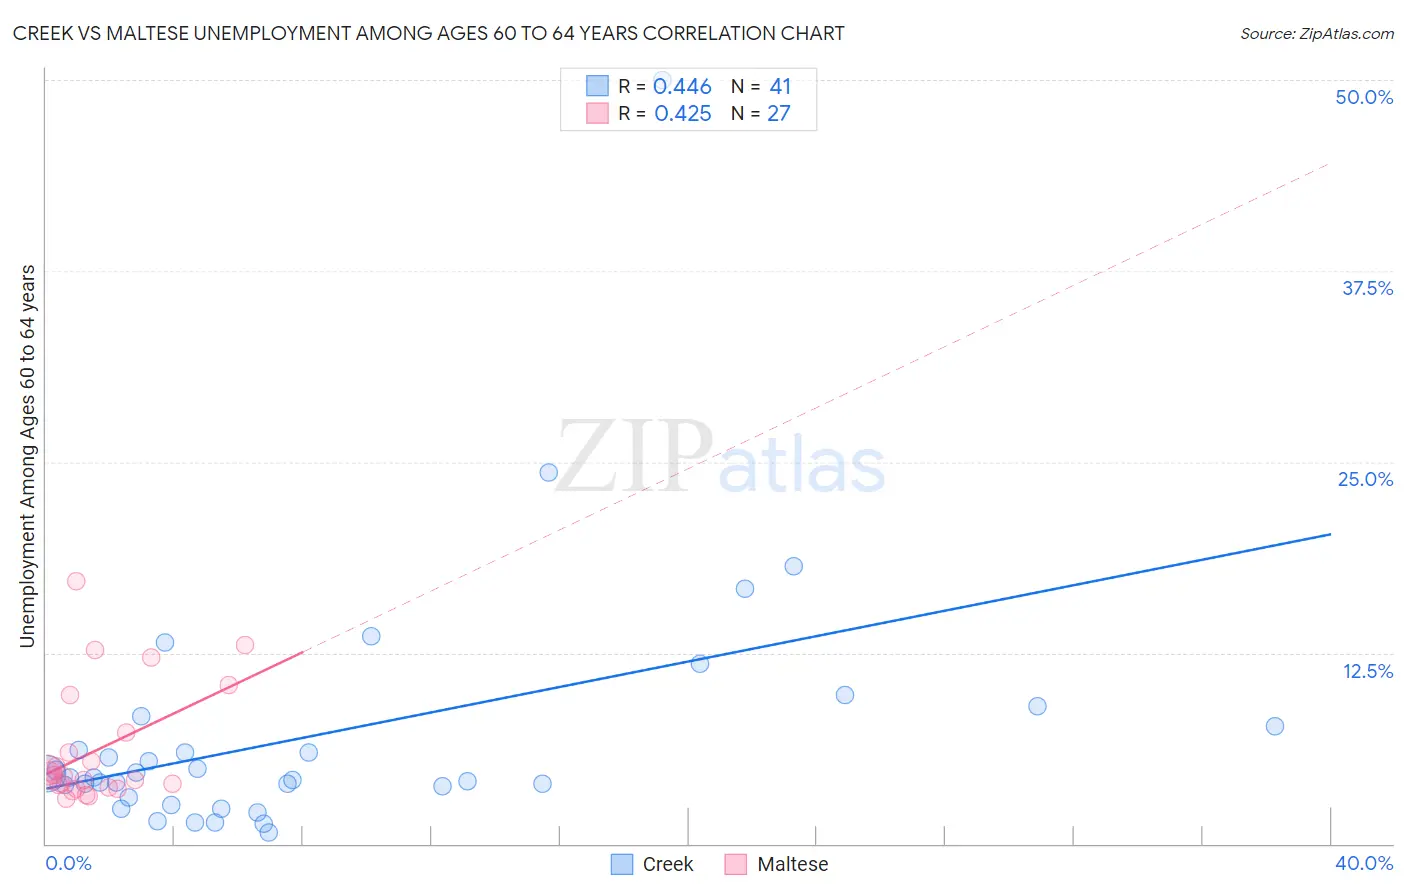
Creek vs Maltese Unemployment Among Ages 60 to 64 years Correlation Chart

The statistical analysis conducted on geographies consisting of 164,830,409 people shows a moderate positive correlation between the proportion of Creek and unemployment rate among population between the ages 60 and 64 in the United States with a correlation coefficient (R) of 0.446 and weighted average of 4.6%. Similarly, the statistical analysis conducted on geographies consisting of 121,799,691 people shows a moderate positive correlation between the proportion of Maltese and unemployment rate among population between the ages 60 and 64 in the United States with a correlation coefficient (R) of 0.425 and weighted average of 4.7%, a difference of 1.9%.
Creek vs Maltese Unemployment Among Ages 60 to 64 years

Unemployment Among Ages 60 to 64 years Correlation Summary

MeasurementCreekMaltese
Minimum0.70%2.9%
Maximum50.0%17.2%
Range49.3%14.2%
Mean7.2%6.1%
Median4.4%4.4%
Interquartile 25% (IQ1)3.4%3.7%
Interquartile 75% (IQ3)8.0%7.3%
Interquartile Range (IQR)4.6%3.6%
Standard Deviation (Sample)8.5%3.8%
Standard Deviation (Population)8.4%3.7%

Similar Demographics by Unemployment Among Ages 60 to 64 years

Demographics Similar to Creek by Unemployment Among Ages 60 to 64 years

In terms of unemployment among ages 60 to 64 years, the demographic groups most similar to Creek are Croatian (4.6%, a difference of 0.080%), Immigrants from Laos (4.6%, a difference of 0.10%), Immigrants from Scotland (4.6%, a difference of 0.13%), Hawaiian (4.6%, a difference of 0.15%), and Slavic (4.6%, a difference of 0.16%).
DemographicsRating | RankUnemployment Among Ages 60 to 64 years
Senegalese
99.7
/100
|
#62
Exceptional
4.6%
Czechoslovakians
99.7
/100
|
#63
Exceptional
4.6%
Immigrants | Middle Africa
99.7
/100
|
#64
Exceptional
4.6%
Jordanians
99.7
/100
|
#65
Exceptional
4.6%
Hawaiians
99.6
/100
|
#66
Exceptional
4.6%
Immigrants | Scotland
99.6
/100
|
#67
Exceptional
4.6%
Immigrants | Laos
99.6
/100
|
#68
Exceptional
4.6%
Creek
99.6
/100
|
#69
Exceptional
4.6%
Croatians
99.5
/100
|
#70
Exceptional
4.6%
Slavs
99.5
/100
|
#71
Exceptional
4.6%
Tongans
99.5
/100
|
#72
Exceptional
4.6%
Immigrants | Eastern Africa
99.5
/100
|
#73
Exceptional
4.6%
Northern Europeans
99.3
/100
|
#74
Exceptional
4.6%
Potawatomi
99.3
/100
|
#75
Exceptional
4.6%
Slovaks
99.3
/100
|
#76
Exceptional
4.6%

Demographics Similar to Maltese by Unemployment Among Ages 60 to 64 years

In terms of unemployment among ages 60 to 64 years, the demographic groups most similar to Maltese are Bulgarian (4.7%, a difference of 0.0%), Immigrants from Romania (4.7%, a difference of 0.030%), Immigrants from England (4.7%, a difference of 0.070%), Immigrants from Germany (4.7%, a difference of 0.070%), and Syrian (4.7%, a difference of 0.12%).
DemographicsRating | RankUnemployment Among Ages 60 to 64 years
Greeks
97.5
/100
|
#107
Exceptional
4.7%
Immigrants | Japan
97.4
/100
|
#108
Exceptional
4.7%
Immigrants | Netherlands
97.4
/100
|
#109
Exceptional
4.7%
Ethiopians
97.2
/100
|
#110
Exceptional
4.7%
French
97.1
/100
|
#111
Exceptional
4.7%
Syrians
97.0
/100
|
#112
Exceptional
4.7%
Bulgarians
96.6
/100
|
#113
Exceptional
4.7%
Maltese
96.5
/100
|
#114
Exceptional
4.7%
Immigrants | Romania
96.4
/100
|
#115
Exceptional
4.7%
Immigrants | England
96.3
/100
|
#116
Exceptional
4.7%
Immigrants | Germany
96.3
/100
|
#117
Exceptional
4.7%
Ukrainians
96.1
/100
|
#118
Exceptional
4.7%
Immigrants | Morocco
95.7
/100
|
#119
Exceptional
4.7%
Macedonians
95.7
/100
|
#120
Exceptional
4.7%
Albanians
95.3
/100
|
#121
Exceptional
4.7%