Cree vs Polish Unemployment Among Women with Children Ages 6 to 17 years
COMPARE
Cree
Polish
Unemployment Among Women with Children Ages 6 to 17 years
Unemployment Among Women with Children Ages 6 to 17 years Comparison
Cree
Poles
10.8%
UNEMPLOYMENT AMONG WOMEN WITH CHILDREN AGES 6 TO 17 YEARS
0.0/ 100
METRIC RATING
322nd/ 347
METRIC RANK
9.4%
UNEMPLOYMENT AMONG WOMEN WITH CHILDREN AGES 6 TO 17 YEARS
1.5/ 100
METRIC RATING
247th/ 347
METRIC RANK
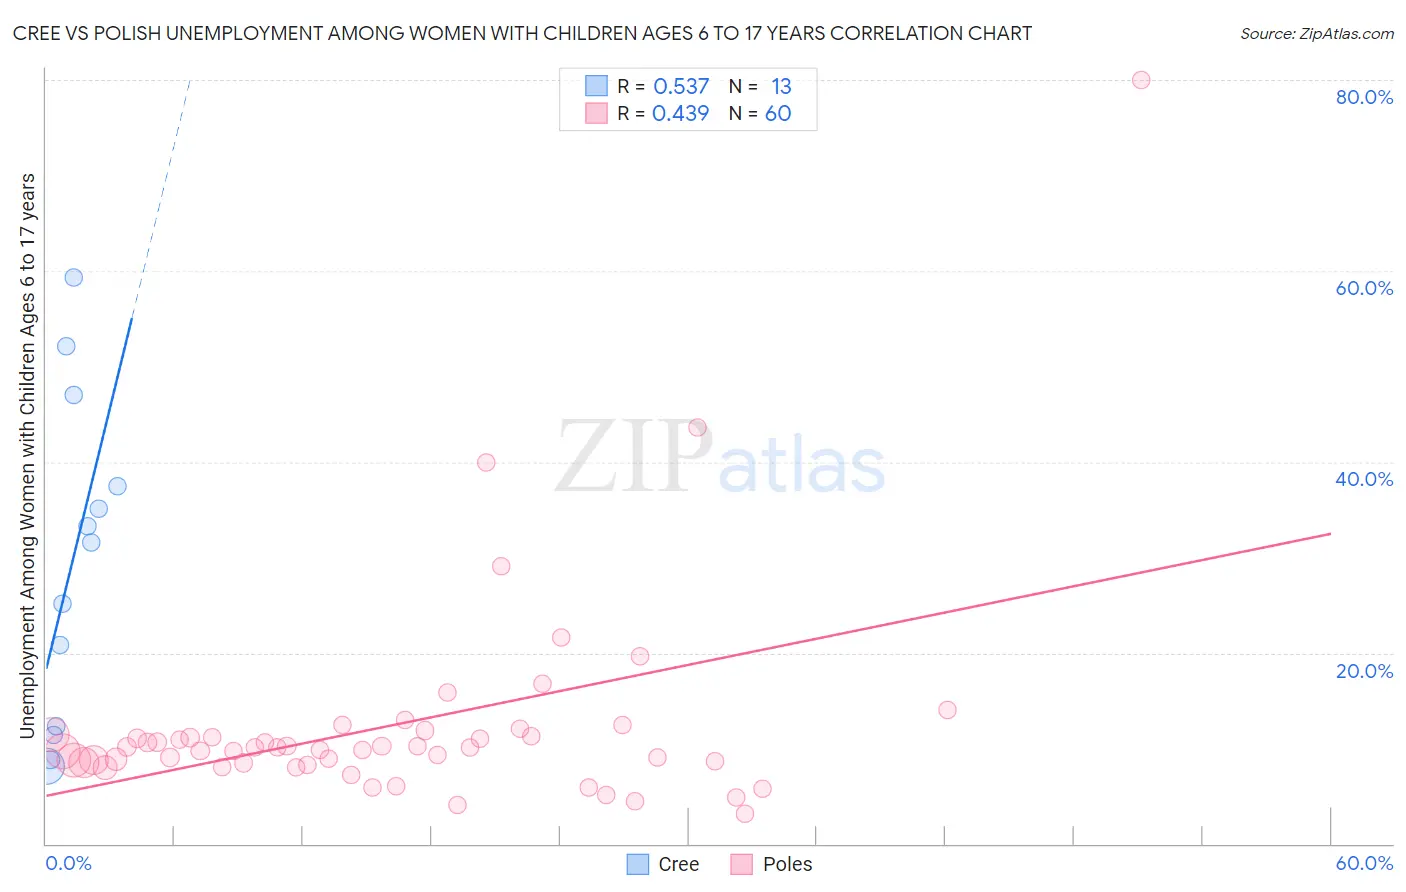
Cree vs Polish Unemployment Among Women with Children Ages 6 to 17 years Correlation Chart
The statistical analysis conducted on geographies consisting of 67,879,761 people shows a substantial positive correlation between the proportion of Cree and unemployment rate among women with children between the ages 6 and 17 in the United States with a correlation coefficient (R) of 0.537 and weighted average of 10.8%. Similarly, the statistical analysis conducted on geographies consisting of 352,978,208 people shows a moderate positive correlation between the proportion of Poles and unemployment rate among women with children between the ages 6 and 17 in the United States with a correlation coefficient (R) of 0.439 and weighted average of 9.4%, a difference of 15.3%.
Unemployment Among Women with Children Ages 6 to 17 years Correlation Summary
| Measurement | Cree | Polish |
| Minimum | 8.1% | 3.2% |
| Maximum | 59.3% | 80.0% |
| Range | 51.3% | 76.8% |
| Mean | 29.4% | 12.4% |
| Median | 31.6% | 10.1% |
| Interquartile 25% (IQ1) | 11.9% | 8.5% |
| Interquartile 75% (IQ3) | 42.3% | 11.4% |
| Interquartile Range (IQR) | 30.4% | 2.9% |
| Standard Deviation (Sample) | 16.9% | 11.3% |
| Standard Deviation (Population) | 16.2% | 11.2% |
Similar Demographics by Unemployment Among Women with Children Ages 6 to 17 years
Demographics Similar to Cree by Unemployment Among Women with Children Ages 6 to 17 years
In terms of unemployment among women with children ages 6 to 17 years, the demographic groups most similar to Cree are Dominican (10.8%, a difference of 0.050%), Immigrants from Dominican Republic (10.8%, a difference of 0.11%), Cajun (10.8%, a difference of 0.29%), Liberian (10.8%, a difference of 0.36%), and Cape Verdean (10.9%, a difference of 0.43%).
| Demographics | Rating | Rank | Unemployment Among Women with Children Ages 6 to 17 years |
| Bahamians | 0.0 /100 | #315 | Tragic 10.4% |
| Immigrants | Dominica | 0.0 /100 | #316 | Tragic 10.5% |
| Bermudans | 0.0 /100 | #317 | Tragic 10.5% |
| Delaware | 0.0 /100 | #318 | Tragic 10.5% |
| Immigrants | Uganda | 0.0 /100 | #319 | Tragic 10.7% |
| Apache | 0.0 /100 | #320 | Tragic 10.7% |
| Tohono O'odham | 0.0 /100 | #321 | Tragic 10.7% |
| Cree | 0.0 /100 | #322 | Tragic 10.8% |
| Dominicans | 0.0 /100 | #323 | Tragic 10.8% |
| Immigrants | Dominican Republic | 0.0 /100 | #324 | Tragic 10.8% |
| Cajuns | 0.0 /100 | #325 | Tragic 10.8% |
| Liberians | 0.0 /100 | #326 | Tragic 10.8% |
| Cape Verdeans | 0.0 /100 | #327 | Tragic 10.9% |
| Ottawa | 0.0 /100 | #328 | Tragic 10.9% |
| Pennsylvania Germans | 0.0 /100 | #329 | Tragic 11.0% |
Demographics Similar to Poles by Unemployment Among Women with Children Ages 6 to 17 years
In terms of unemployment among women with children ages 6 to 17 years, the demographic groups most similar to Poles are Immigrants from Africa (9.4%, a difference of 0.030%), Dutch (9.4%, a difference of 0.040%), Immigrants from South America (9.4%, a difference of 0.050%), Immigrants from Guatemala (9.4%, a difference of 0.14%), and Central American (9.4%, a difference of 0.15%).
| Demographics | Rating | Rank | Unemployment Among Women with Children Ages 6 to 17 years |
| Guatemalans | 2.3 /100 | #240 | Tragic 9.3% |
| Colombians | 2.2 /100 | #241 | Tragic 9.3% |
| Immigrants | Colombia | 2.1 /100 | #242 | Tragic 9.3% |
| Scottish | 2.0 /100 | #243 | Tragic 9.4% |
| English | 1.9 /100 | #244 | Tragic 9.4% |
| Immigrants | Cameroon | 1.8 /100 | #245 | Tragic 9.4% |
| Immigrants | Africa | 1.6 /100 | #246 | Tragic 9.4% |
| Poles | 1.5 /100 | #247 | Tragic 9.4% |
| Dutch | 1.5 /100 | #248 | Tragic 9.4% |
| Immigrants | South America | 1.5 /100 | #249 | Tragic 9.4% |
| Immigrants | Guatemala | 1.3 /100 | #250 | Tragic 9.4% |
| Central Americans | 1.3 /100 | #251 | Tragic 9.4% |
| Creek | 1.2 /100 | #252 | Tragic 9.4% |
| Portuguese | 1.1 /100 | #253 | Tragic 9.4% |
| Nicaraguans | 1.0 /100 | #254 | Tragic 9.4% |