Cree vs Fijian Unemployment Among Women with Children Under 6 years
COMPARE
Cree
Fijian
Unemployment Among Women with Children Under 6 years
Unemployment Among Women with Children Under 6 years Comparison
Cree
Fijians
7.6%
UNEMPLOYMENT AMONG WOMEN WITH CHILDREN UNDER 6 YEARS
51.6/ 100
METRIC RATING
173rd/ 347
METRIC RANK
9.3%
UNEMPLOYMENT AMONG WOMEN WITH CHILDREN UNDER 6 YEARS
0.0/ 100
METRIC RATING
314th/ 347
METRIC RANK
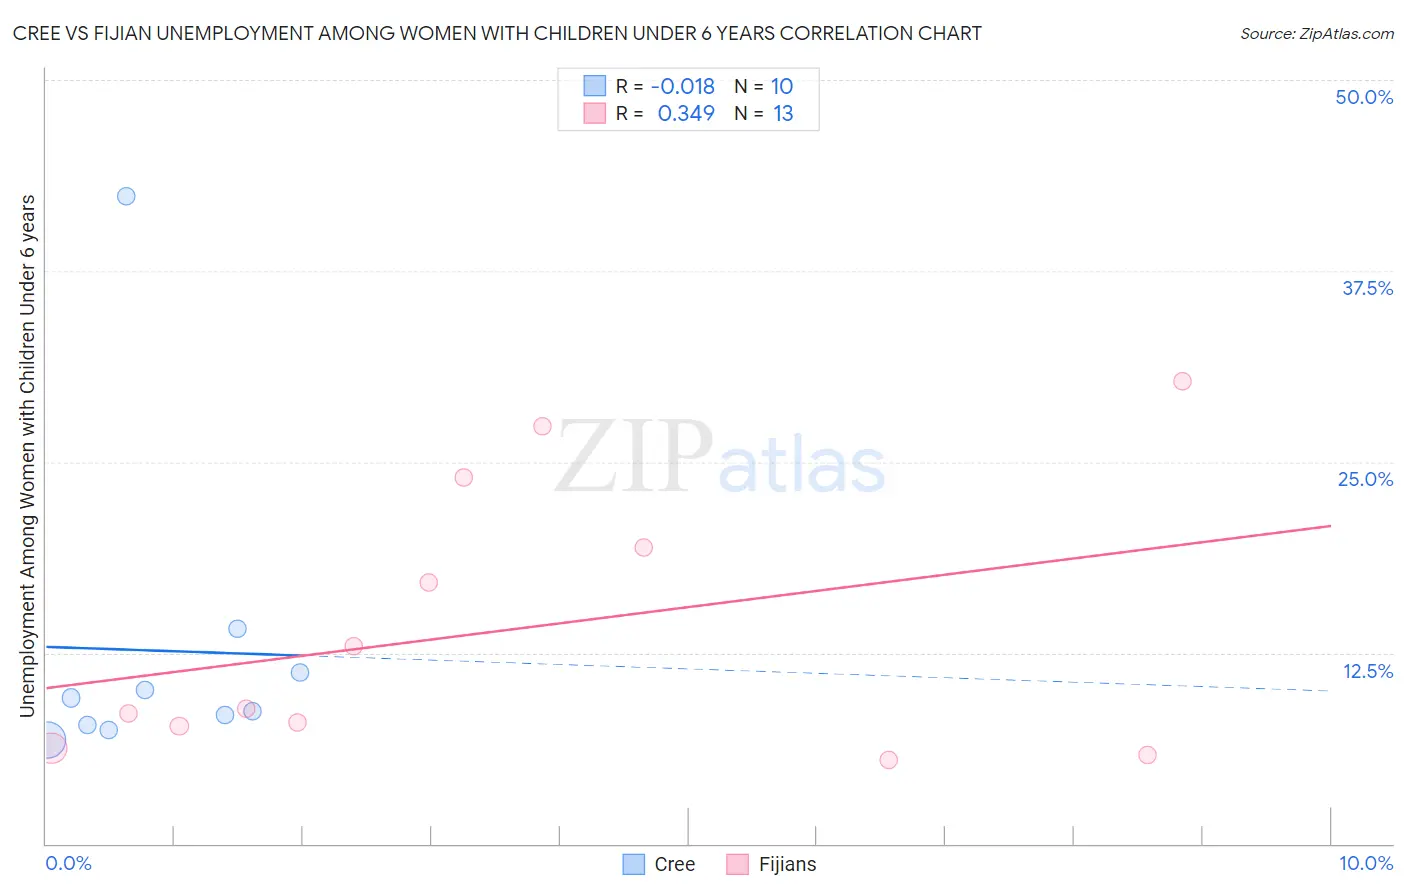
Cree vs Fijian Unemployment Among Women with Children Under 6 years Correlation Chart
The statistical analysis conducted on geographies consisting of 69,437,717 people shows no correlation between the proportion of Cree and unemployment rate among women with children under the age of 6 in the United States with a correlation coefficient (R) of -0.018 and weighted average of 7.6%. Similarly, the statistical analysis conducted on geographies consisting of 52,101,365 people shows a mild positive correlation between the proportion of Fijians and unemployment rate among women with children under the age of 6 in the United States with a correlation coefficient (R) of 0.349 and weighted average of 9.3%, a difference of 21.2%.
Unemployment Among Women with Children Under 6 years Correlation Summary
| Measurement | Cree | Fijian |
| Minimum | 6.8% | 5.5% |
| Maximum | 42.4% | 30.3% |
| Range | 35.6% | 24.8% |
| Mean | 12.6% | 14.0% |
| Median | 9.1% | 8.8% |
| Interquartile 25% (IQ1) | 7.8% | 7.0% |
| Interquartile 75% (IQ3) | 11.2% | 21.7% |
| Interquartile Range (IQR) | 3.4% | 14.7% |
| Standard Deviation (Sample) | 10.7% | 8.7% |
| Standard Deviation (Population) | 10.1% | 8.4% |
Similar Demographics by Unemployment Among Women with Children Under 6 years
Demographics Similar to Cree by Unemployment Among Women with Children Under 6 years
In terms of unemployment among women with children under 6 years, the demographic groups most similar to Cree are Immigrants from Laos (7.6%, a difference of 0.11%), Panamanian (7.6%, a difference of 0.13%), Puget Sound Salish (7.7%, a difference of 0.26%), Austrian (7.7%, a difference of 0.37%), and Immigrants from North America (7.6%, a difference of 0.41%).
| Demographics | Rating | Rank | Unemployment Among Women with Children Under 6 years |
| Belgians | 63.5 /100 | #166 | Good 7.6% |
| Kenyans | 62.5 /100 | #167 | Good 7.6% |
| Immigrants | Canada | 61.6 /100 | #168 | Good 7.6% |
| Immigrants | Scotland | 61.3 /100 | #169 | Good 7.6% |
| Czechs | 59.8 /100 | #170 | Average 7.6% |
| Immigrants | Grenada | 59.0 /100 | #171 | Average 7.6% |
| Immigrants | North America | 57.7 /100 | #172 | Average 7.6% |
| Cree | 51.6 /100 | #173 | Average 7.6% |
| Immigrants | Laos | 50.0 /100 | #174 | Average 7.6% |
| Panamanians | 49.6 /100 | #175 | Average 7.6% |
| Puget Sound Salish | 47.7 /100 | #176 | Average 7.7% |
| Austrians | 46.0 /100 | #177 | Average 7.7% |
| Immigrants | England | 45.4 /100 | #178 | Average 7.7% |
| Immigrants | Western Europe | 44.9 /100 | #179 | Average 7.7% |
| Immigrants | Uruguay | 44.5 /100 | #180 | Average 7.7% |
Demographics Similar to Fijians by Unemployment Among Women with Children Under 6 years
In terms of unemployment among women with children under 6 years, the demographic groups most similar to Fijians are American (9.3%, a difference of 0.030%), Immigrants from the Azores (9.2%, a difference of 0.46%), French American Indian (9.2%, a difference of 0.61%), Cherokee (9.3%, a difference of 0.78%), and Cajun (9.2%, a difference of 0.88%).
| Demographics | Rating | Rank | Unemployment Among Women with Children Under 6 years |
| Dominicans | 0.0 /100 | #307 | Tragic 9.1% |
| Immigrants | Micronesia | 0.0 /100 | #308 | Tragic 9.1% |
| Africans | 0.0 /100 | #309 | Tragic 9.2% |
| Cajuns | 0.0 /100 | #310 | Tragic 9.2% |
| French American Indians | 0.0 /100 | #311 | Tragic 9.2% |
| Immigrants | Azores | 0.0 /100 | #312 | Tragic 9.2% |
| Americans | 0.0 /100 | #313 | Tragic 9.3% |
| Fijians | 0.0 /100 | #314 | Tragic 9.3% |
| Cherokee | 0.0 /100 | #315 | Tragic 9.3% |
| Houma | 0.0 /100 | #316 | Tragic 9.4% |
| Dutch West Indians | 0.0 /100 | #317 | Tragic 9.5% |
| Osage | 0.0 /100 | #318 | Tragic 9.5% |
| Marshallese | 0.0 /100 | #319 | Tragic 9.6% |
| Potawatomi | 0.0 /100 | #320 | Tragic 9.6% |
| Central American Indians | 0.0 /100 | #321 | Tragic 9.6% |