Costa Rican vs U.S. Virgin Islander Unemployment Among Ages 60 to 64 years

COMPARE

Costa Rican
Race
Ancestry
AfghanAfricanAlaska NativeAlaskan AthabascanAlbanianAleutAlsatianAmericanApacheArabArapahoArgentineanArmenianAssyrian/Chaldean/SyriacAustralianAustrianBahamianBangladeshiBarbadianBasqueBelgianBelizeanBermudanBhutaneseBlackfeetBolivianBrazilianBritishBritish West IndianBulgarianBurmeseCajunCambodianCanadianCape VerdeanCarpatho RusynCelticCentral AmericanCentral American IndianCherokeeCheyenneChickasawChileanChineseChippewaChoctawColombianColvilleComancheCosta RicanCreeCreekCroatianCrowCubanCypriotCzechCzechoslovakianDanishDelawareDominicanDutchDutch West IndianEastern EuropeanEcuadorianEgyptianEnglishEstonianEthiopianEuropeanFijianFilipinoFinnishFrenchFrench American IndianFrench CanadianGermanGerman RussianGhanaianGreekGuamanian/ChamorroGuatemalanGuyaneseHaitianHmongHonduranHopiHoumaHungarianIcelanderIndian (Asian)IndonesianInupiatIranianIraqiIrishIroquoisIsraeliItalianJamaicanJapaneseJordanianKenyanKiowaKoreanLaotianLatvianLebaneseLiberianLithuanianLumbeeLuxembourgerMacedonianMalaysianMalteseMarshalleseMenomineeMexicanMexican American IndianMongolianMoroccanNative HawaiianNavajoNepaleseNew ZealanderNicaraguanNigerianNorthern EuropeanNorwegianOkinawanOsageOttawaPaiutePakistaniPalestinianPanamanianParaguayanPennsylvania GermanPeruvianPimaPolishPortuguesePotawatomiPuebloPuerto RicanPuget Sound SalishRomanianRussianSalvadoranSamoanScandinavianScotch-IrishScottishSeminoleSenegaleseSerbianShoshoneSierra LeoneanSiouxSlavicSlovakSloveneSomaliSouth AfricanSouth AmericanSouth American IndianSoviet UnionSpaniardSpanishSpanish AmericanSpanish American IndianSri LankanSubsaharan AfricanSudaneseSwedishSwissSyrianTaiwaneseThaiTlingit-HaidaTohono O'OdhamTonganTrinidadian and TobagonianTsimshianTurkishUgandanUkrainianUruguayanUteVenezuelanVietnameseWelshWest IndianYakamaYaquiYugoslavianYumanYup'ikZimbabwean
Immigration
NonimmigrantsImmigrantsAfghanistanAfricaAlbaniaArgentinaArmeniaAsiaAustraliaAustriaBahamasBangladeshBarbadosBelarusBelgiumBelizeBoliviaBosnia and HerzegovinaBrazilBulgariaBurma/MyanmarCabo VerdeCambodiaCameroonCanadaCaribbeanCentral AmericaChileChinaColombiaCongoCosta RicaCroatiaCubaCzechoslovakiaDenmarkDominicaDominican RepublicEastern AfricaEastern AsiaEastern EuropeEcuadorEgyptEl SalvadorEnglandEritreaEthiopiaEuropeFijiFranceGermanyGhanaGreeceGrenadaGuatemalaGuyanaHaitiHondurasHong KongHungaryIndiaIndonesiaIranIraqIrelandIsraelItalyJamaicaJapanJordanKazakhstanKenyaKoreaKuwaitLaosLatin AmericaLatviaLebanonLiberiaLithuaniaMalaysiaMexicoMicronesiaMiddle AfricaMoldovaMoroccoNepalNetherlandsNicaraguaNigeriaNorth AmericaNorth MacedoniaNorthern AfricaNorthern EuropeNorwayOceaniaPakistanPanamaPeruPhilippinesPolandPortugalRomaniaRussiaSaudi ArabiaScotlandSenegalSerbiaSierra LeoneSingaporeSomaliaSouth AfricaSouth AmericaSouth Central AsiaSouth Eastern AsiaSouthern EuropeSpainSri LankaSt. Vincent and the GrenadinesSudanSwedenSwitzerlandSyriaTaiwanThailandTrinidad and TobagoTurkeyUgandaUkraineUruguayUzbekistanVenezuelaVietnamWest IndiesWestern AfricaWestern AsiaWestern EuropeYemenZaireZimbabweAzores
U.S. Virgin Islander
Race
Ancestry
AfghanAfricanAlaska NativeAlaskan AthabascanAlbanianAleutAlsatianAmericanApacheArabArapahoArgentineanArmenianAssyrian/Chaldean/SyriacAustralianAustrianBahamianBangladeshiBarbadianBasqueBelgianBelizeanBermudanBhutaneseBlackfeetBolivianBrazilianBritishBritish West IndianBulgarianBurmeseCajunCambodianCanadianCape VerdeanCarpatho RusynCelticCentral AmericanCentral American IndianCherokeeCheyenneChickasawChileanChineseChippewaChoctawColombianColvilleComancheCreeCreekCroatianCrowCubanCypriotCzechCzechoslovakianDanishDelawareDominicanDutchDutch West IndianEastern EuropeanEcuadorianEgyptianEnglishEstonianEthiopianEuropeanFijianFilipinoFinnishFrenchFrench American IndianFrench CanadianGermanGerman RussianGhanaianGreekGuamanian/ChamorroGuatemalanGuyaneseHaitianHmongHonduranHopiHoumaHungarianIcelanderIndian (Asian)IndonesianInupiatIranianIraqiIrishIroquoisIsraeliItalianJamaicanJapaneseJordanianKenyanKiowaKoreanLaotianLatvianLebaneseLiberianLithuanianLumbeeLuxembourgerMacedonianMalaysianMalteseMarshalleseMenomineeMexicanMexican American IndianMongolianMoroccanNative HawaiianNavajoNepaleseNew ZealanderNicaraguanNigerianNorthern EuropeanNorwegianOkinawanOsageOttawaPaiutePakistaniPalestinianPanamanianParaguayanPennsylvania GermanPeruvianPimaPolishPortuguesePotawatomiPuebloPuerto RicanPuget Sound SalishRomanianRussianSalvadoranSamoanScandinavianScotch-IrishScottishSeminoleSenegaleseSerbianShoshoneSierra LeoneanSiouxSlavicSlovakSloveneSomaliSouth AfricanSouth AmericanSouth American IndianSoviet UnionSpaniardSpanishSpanish AmericanSpanish American IndianSri LankanSubsaharan AfricanSudaneseSwedishSwissSyrianTaiwaneseThaiTlingit-HaidaTohono O'OdhamTonganTrinidadian and TobagonianTsimshianTurkishU.S. Virgin IslanderUgandanUkrainianUruguayanUteVenezuelanVietnameseWelshWest IndianYakamaYaquiYugoslavianYumanYup'ikZimbabwean
Immigration
NonimmigrantsImmigrantsAfghanistanAfricaAlbaniaArgentinaArmeniaAsiaAustraliaAustriaBahamasBangladeshBarbadosBelarusBelgiumBelizeBoliviaBosnia and HerzegovinaBrazilBulgariaBurma/MyanmarCabo VerdeCambodiaCameroonCanadaCaribbeanCentral AmericaChileChinaColombiaCongoCosta RicaCroatiaCubaCzechoslovakiaDenmarkDominicaDominican RepublicEastern AfricaEastern AsiaEastern EuropeEcuadorEgyptEl SalvadorEnglandEritreaEthiopiaEuropeFijiFranceGermanyGhanaGreeceGrenadaGuatemalaGuyanaHaitiHondurasHong KongHungaryIndiaIndonesiaIranIraqIrelandIsraelItalyJamaicaJapanJordanKazakhstanKenyaKoreaKuwaitLaosLatin AmericaLatviaLebanonLiberiaLithuaniaMalaysiaMexicoMicronesiaMiddle AfricaMoldovaMoroccoNepalNetherlandsNicaraguaNigeriaNorth AmericaNorth MacedoniaNorthern AfricaNorthern EuropeNorwayOceaniaPakistanPanamaPeruPhilippinesPolandPortugalRomaniaRussiaSaudi ArabiaScotlandSenegalSerbiaSierra LeoneSingaporeSomaliaSouth AfricaSouth AmericaSouth Central AsiaSouth Eastern AsiaSouthern EuropeSpainSri LankaSt. Vincent and the GrenadinesSudanSwedenSwitzerlandSyriaTaiwanThailandTrinidad and TobagoTurkeyUgandaUkraineUruguayUzbekistanVenezuelaVietnamWest IndiesWestern AfricaWestern AsiaWestern EuropeYemenZaireZimbabweAzores
Unemployment Among Ages 60 to 64 years
Income
Poverty
Unemployment
Labor Participation
Family Structure
Vehicle Availability
Education Level
Disability

Unemployment Among Ages 60 to 64 years Comparison

Costa Ricans

U.S. Virgin Islanders

Tragic
Tragic
5.1%
UNEMPLOYMENT AMONG AGES 60 TO 64 YEARS
0.8/ 100
METRIC RATING
254th/ 347
METRIC RANK
5.5%
UNEMPLOYMENT AMONG AGES 60 TO 64 YEARS
0.0/ 100
METRIC RATING
311th/ 347
METRIC RANK

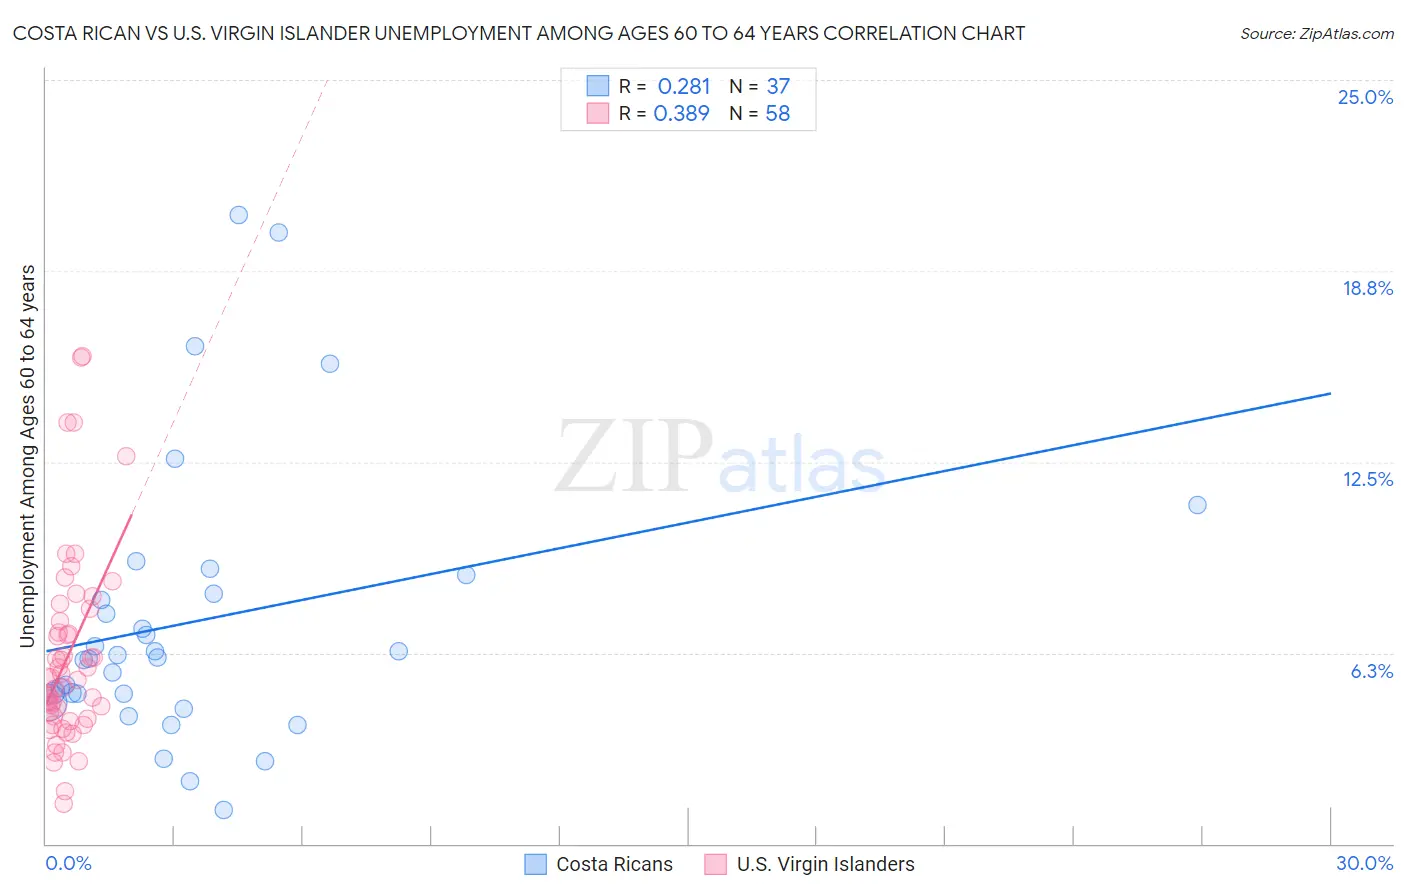
Costa Rican vs U.S. Virgin Islander Unemployment Among Ages 60 to 64 years Correlation Chart

The statistical analysis conducted on geographies consisting of 239,758,447 people shows a weak positive correlation between the proportion of Costa Ricans and unemployment rate among population between the ages 60 and 64 in the United States with a correlation coefficient (R) of 0.281 and weighted average of 5.1%. Similarly, the statistical analysis conducted on geographies consisting of 85,222,244 people shows a mild positive correlation between the proportion of U.S. Virgin Islanders and unemployment rate among population between the ages 60 and 64 in the United States with a correlation coefficient (R) of 0.389 and weighted average of 5.5%, a difference of 7.8%.
Costa Rican vs U.S. Virgin Islander Unemployment Among Ages 60 to 64 years

Unemployment Among Ages 60 to 64 years Correlation Summary

MeasurementCosta RicanU.S. Virgin Islander
Minimum1.1%1.3%
Maximum20.6%16.0%
Range19.5%14.7%
Mean7.3%6.1%
Median6.1%5.4%
Interquartile 25% (IQ1)4.8%4.1%
Interquartile 75% (IQ3)8.5%7.3%
Interquartile Range (IQR)3.7%3.2%
Standard Deviation (Sample)4.5%3.2%
Standard Deviation (Population)4.5%3.2%

Similar Demographics by Unemployment Among Ages 60 to 64 years

Demographics Similar to Costa Ricans by Unemployment Among Ages 60 to 64 years

In terms of unemployment among ages 60 to 64 years, the demographic groups most similar to Costa Ricans are Estonian (5.1%, a difference of 0.010%), Immigrants from China (5.1%, a difference of 0.030%), Immigrants from Switzerland (5.1%, a difference of 0.070%), Immigrants from Uruguay (5.1%, a difference of 0.080%), and Immigrants from Cambodia (5.1%, a difference of 0.11%).
DemographicsRating | RankUnemployment Among Ages 60 to 64 years
Immigrants | North Macedonia
1.1
/100
|
#247
Tragic
5.0%
Immigrants | Fiji
1.1
/100
|
#248
Tragic
5.1%
South Americans
1.0
/100
|
#249
Tragic
5.1%
Immigrants | Cambodia
0.9
/100
|
#250
Tragic
5.1%
Immigrants | Uruguay
0.9
/100
|
#251
Tragic
5.1%
Immigrants | Switzerland
0.9
/100
|
#252
Tragic
5.1%
Immigrants | China
0.9
/100
|
#253
Tragic
5.1%
Costa Ricans
0.8
/100
|
#254
Tragic
5.1%
Estonians
0.8
/100
|
#255
Tragic
5.1%
Immigrants | Peru
0.7
/100
|
#256
Tragic
5.1%
Japanese
0.6
/100
|
#257
Tragic
5.1%
Celtics
0.5
/100
|
#258
Tragic
5.1%
Hondurans
0.5
/100
|
#259
Tragic
5.1%
Immigrants | Honduras
0.4
/100
|
#260
Tragic
5.1%
Immigrants | Ghana
0.4
/100
|
#261
Tragic
5.1%

Demographics Similar to U.S. Virgin Islanders by Unemployment Among Ages 60 to 64 years

In terms of unemployment among ages 60 to 64 years, the demographic groups most similar to U.S. Virgin Islanders are British West Indian (5.5%, a difference of 0.020%), Immigrants from West Indies (5.5%, a difference of 0.19%), Belizean (5.5%, a difference of 0.89%), Soviet Union (5.4%, a difference of 0.94%), and Spanish American Indian (5.4%, a difference of 0.95%).
DemographicsRating | RankUnemployment Among Ages 60 to 64 years
Immigrants | Mexico
0.0
/100
|
#304
Tragic
5.4%
Cypriots
0.0
/100
|
#305
Tragic
5.4%
Immigrants | Dominica
0.0
/100
|
#306
Tragic
5.4%
Immigrants | Guyana
0.0
/100
|
#307
Tragic
5.4%
Spanish American Indians
0.0
/100
|
#308
Tragic
5.4%
Soviet Union
0.0
/100
|
#309
Tragic
5.4%
British West Indians
0.0
/100
|
#310
Tragic
5.5%
U.S. Virgin Islanders
0.0
/100
|
#311
Tragic
5.5%
Immigrants | West Indies
0.0
/100
|
#312
Tragic
5.5%
Belizeans
0.0
/100
|
#313
Tragic
5.5%
Guyanese
0.0
/100
|
#314
Tragic
5.5%
Cree
0.0
/100
|
#315
Tragic
5.6%
Cheyenne
0.0
/100
|
#316
Tragic
5.6%
Shoshone
0.0
/100
|
#317
Tragic
5.7%
Natives/Alaskans
0.0
/100
|
#318
Tragic
5.7%