Costa Rican vs Immigrants from Canada Unemployment Among Ages 45 to 54 years
COMPARE
Costa Rican
Immigrants from Canada
Unemployment Among Ages 45 to 54 years
Unemployment Among Ages 45 to 54 years Comparison
Costa Ricans
Immigrants from Canada
4.5%
UNEMPLOYMENT AMONG AGES 45 TO 54 YEARS
75.3/ 100
METRIC RATING
149th/ 347
METRIC RANK
4.4%
UNEMPLOYMENT AMONG AGES 45 TO 54 YEARS
95.0/ 100
METRIC RATING
97th/ 347
METRIC RANK
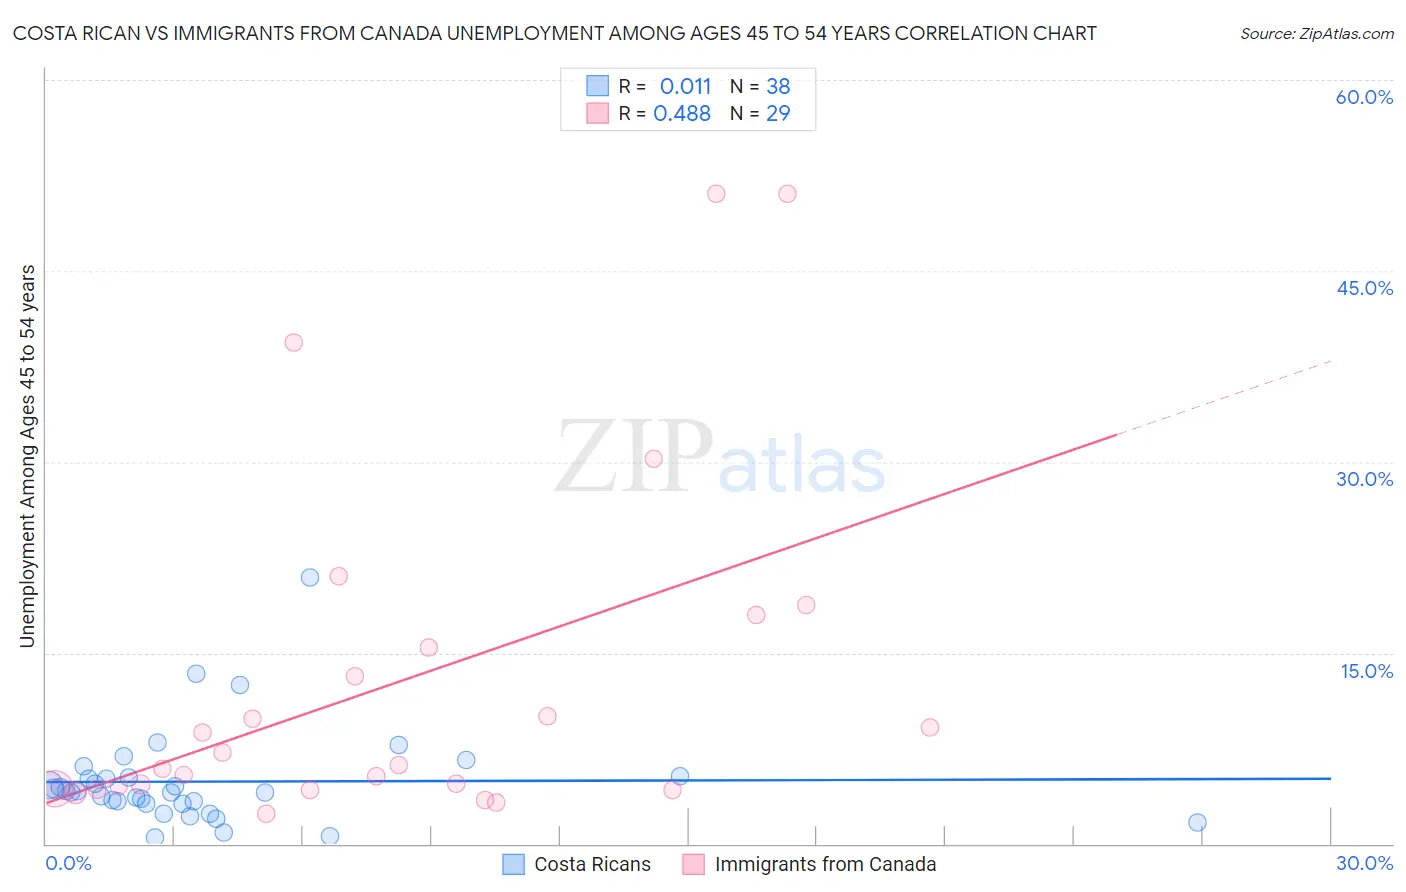
Costa Rican vs Immigrants from Canada Unemployment Among Ages 45 to 54 years Correlation Chart
The statistical analysis conducted on geographies consisting of 250,528,385 people shows no correlation between the proportion of Costa Ricans and unemployment rate among population between the ages 45 and 54 in the United States with a correlation coefficient (R) of 0.011 and weighted average of 4.5%. Similarly, the statistical analysis conducted on geographies consisting of 441,879,123 people shows a moderate positive correlation between the proportion of Immigrants from Canada and unemployment rate among population between the ages 45 and 54 in the United States with a correlation coefficient (R) of 0.488 and weighted average of 4.4%, a difference of 2.2%.
Unemployment Among Ages 45 to 54 years Correlation Summary
| Measurement | Costa Rican | Immigrants from Canada |
| Minimum | 0.50% | 2.4% |
| Maximum | 20.9% | 51.1% |
| Range | 20.4% | 48.7% |
| Mean | 4.9% | 12.7% |
| Median | 4.1% | 6.2% |
| Interquartile 25% (IQ1) | 3.1% | 4.3% |
| Interquartile 75% (IQ3) | 5.2% | 16.7% |
| Interquartile Range (IQR) | 2.1% | 12.4% |
| Standard Deviation (Sample) | 3.8% | 13.7% |
| Standard Deviation (Population) | 3.7% | 13.4% |
Similar Demographics by Unemployment Among Ages 45 to 54 years
Demographics Similar to Costa Ricans by Unemployment Among Ages 45 to 54 years
In terms of unemployment among ages 45 to 54 years, the demographic groups most similar to Costa Ricans are Immigrants from Austria (4.5%, a difference of 0.0%), Tsimshian (4.5%, a difference of 0.040%), Cypriot (4.5%, a difference of 0.060%), Uruguayan (4.5%, a difference of 0.10%), and Syrian (4.5%, a difference of 0.13%).
| Demographics | Rating | Rank | Unemployment Among Ages 45 to 54 years |
| Immigrants | Netherlands | 79.4 /100 | #142 | Good 4.4% |
| Macedonians | 79.0 /100 | #143 | Good 4.5% |
| Taiwanese | 77.9 /100 | #144 | Good 4.5% |
| Immigrants | Latvia | 77.5 /100 | #145 | Good 4.5% |
| Syrians | 77.3 /100 | #146 | Good 4.5% |
| Uruguayans | 76.9 /100 | #147 | Good 4.5% |
| Immigrants | Austria | 75.3 /100 | #148 | Good 4.5% |
| Costa Ricans | 75.3 /100 | #149 | Good 4.5% |
| Tsimshian | 74.6 /100 | #150 | Good 4.5% |
| Cypriots | 74.4 /100 | #151 | Good 4.5% |
| Koreans | 73.1 /100 | #152 | Good 4.5% |
| Hungarians | 73.0 /100 | #153 | Good 4.5% |
| Immigrants | Spain | 72.5 /100 | #154 | Good 4.5% |
| Marshallese | 70.6 /100 | #155 | Good 4.5% |
| Immigrants | Croatia | 69.6 /100 | #156 | Good 4.5% |
Demographics Similar to Immigrants from Canada by Unemployment Among Ages 45 to 54 years
In terms of unemployment among ages 45 to 54 years, the demographic groups most similar to Immigrants from Canada are Romanian (4.4%, a difference of 0.010%), Immigrants from Burma/Myanmar (4.4%, a difference of 0.020%), Immigrants from Eritrea (4.4%, a difference of 0.060%), Indonesian (4.4%, a difference of 0.13%), and Immigrants from North America (4.4%, a difference of 0.24%).
| Demographics | Rating | Rank | Unemployment Among Ages 45 to 54 years |
| Asians | 96.8 /100 | #90 | Exceptional 4.3% |
| Ukrainians | 96.6 /100 | #91 | Exceptional 4.3% |
| Mongolians | 96.6 /100 | #92 | Exceptional 4.3% |
| Argentineans | 96.5 /100 | #93 | Exceptional 4.3% |
| Immigrants | Malaysia | 96.2 /100 | #94 | Exceptional 4.4% |
| Immigrants | Ethiopia | 96.1 /100 | #95 | Exceptional 4.4% |
| Indonesians | 95.4 /100 | #96 | Exceptional 4.4% |
| Immigrants | Canada | 95.0 /100 | #97 | Exceptional 4.4% |
| Romanians | 94.9 /100 | #98 | Exceptional 4.4% |
| Immigrants | Burma/Myanmar | 94.9 /100 | #99 | Exceptional 4.4% |
| Immigrants | Eritrea | 94.7 /100 | #100 | Exceptional 4.4% |
| Immigrants | North America | 93.9 /100 | #101 | Exceptional 4.4% |
| Sri Lankans | 93.7 /100 | #102 | Exceptional 4.4% |
| Icelanders | 93.5 /100 | #103 | Exceptional 4.4% |
| Immigrants | Sweden | 93.0 /100 | #104 | Exceptional 4.4% |