Costa Rican vs Apache Unemployment Among Seniors over 75 years
COMPARE
Costa Rican
Apache
Unemployment Among Seniors over 75 years
Unemployment Among Seniors over 75 years Comparison
Costa Ricans
Apache
9.1%
UNEMPLOYMENT AMONG SENIORS OVER 75 YEARS
6.3/ 100
METRIC RATING
224th/ 347
METRIC RANK
8.4%
UNEMPLOYMENT AMONG SENIORS OVER 75 YEARS
95.2/ 100
METRIC RATING
130th/ 347
METRIC RANK
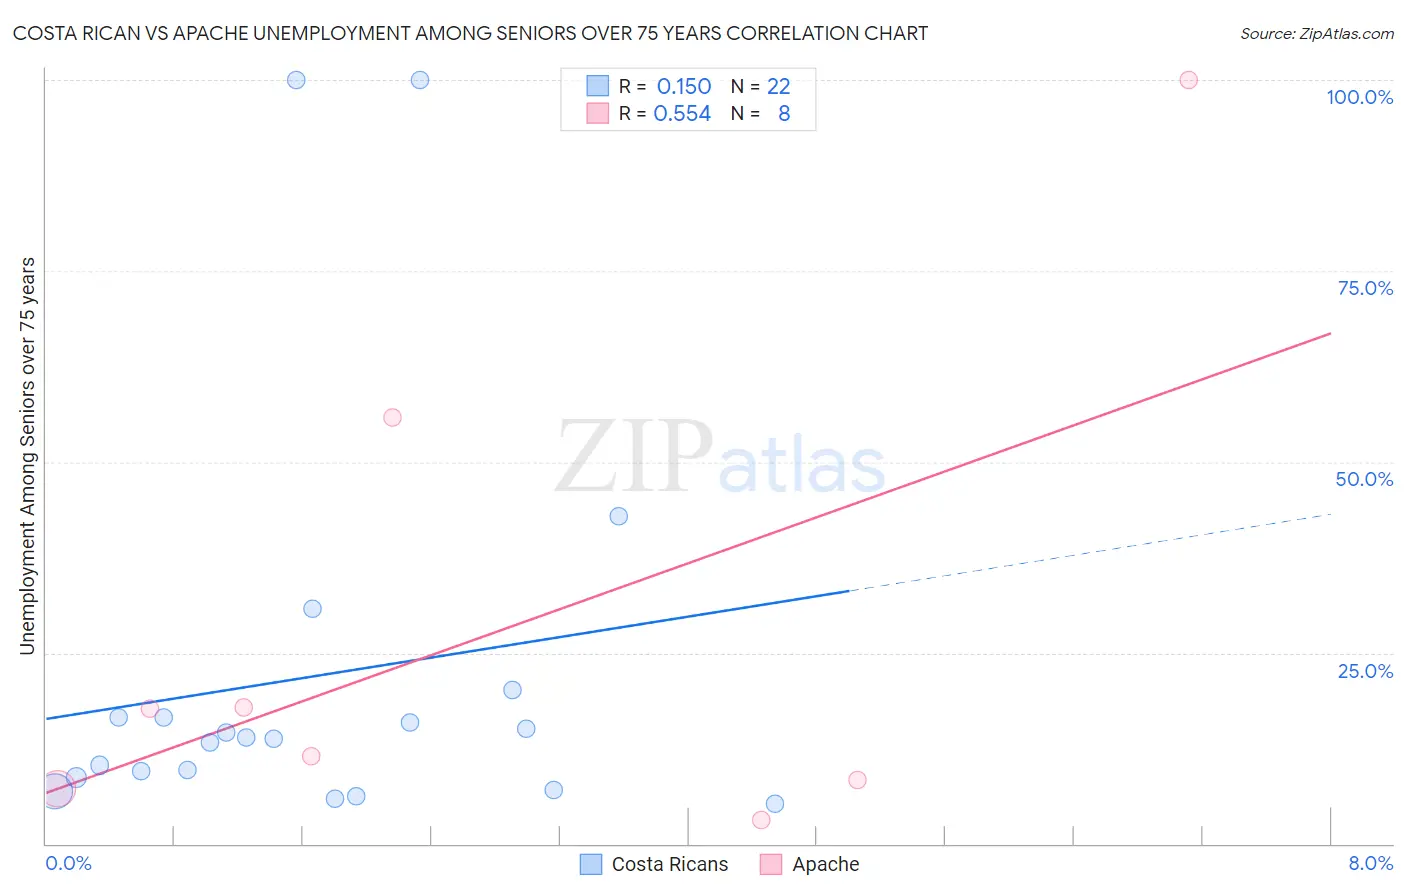
Costa Rican vs Apache Unemployment Among Seniors over 75 years Correlation Chart
The statistical analysis conducted on geographies consisting of 153,154,168 people shows a poor positive correlation between the proportion of Costa Ricans and unemployment rate among seniors over the age of 75 in the United States with a correlation coefficient (R) of 0.150 and weighted average of 9.1%. Similarly, the statistical analysis conducted on geographies consisting of 138,222,080 people shows a substantial positive correlation between the proportion of Apache and unemployment rate among seniors over the age of 75 in the United States with a correlation coefficient (R) of 0.554 and weighted average of 8.4%, a difference of 7.9%.
Unemployment Among Seniors over 75 years Correlation Summary
| Measurement | Costa Rican | Apache |
| Minimum | 5.3% | 3.1% |
| Maximum | 100.0% | 100.0% |
| Range | 94.7% | 96.9% |
| Mean | 21.9% | 27.7% |
| Median | 13.8% | 14.6% |
| Interquartile 25% (IQ1) | 8.7% | 7.8% |
| Interquartile 75% (IQ3) | 16.6% | 36.8% |
| Interquartile Range (IQR) | 7.9% | 29.0% |
| Standard Deviation (Sample) | 26.7% | 33.5% |
| Standard Deviation (Population) | 26.1% | 31.4% |
Similar Demographics by Unemployment Among Seniors over 75 years
Demographics Similar to Costa Ricans by Unemployment Among Seniors over 75 years
In terms of unemployment among seniors over 75 years, the demographic groups most similar to Costa Ricans are Navajo (9.1%, a difference of 0.040%), Immigrants from Bangladesh (9.1%, a difference of 0.090%), Immigrants from Jordan (9.0%, a difference of 0.14%), Samoan (9.1%, a difference of 0.14%), and Peruvian (9.0%, a difference of 0.20%).
| Demographics | Rating | Rank | Unemployment Among Seniors over 75 years |
| Lebanese | 11.1 /100 | #217 | Poor 9.0% |
| Immigrants | Africa | 9.7 /100 | #218 | Tragic 9.0% |
| Afghans | 8.3 /100 | #219 | Tragic 9.0% |
| Immigrants | Zimbabwe | 7.8 /100 | #220 | Tragic 9.0% |
| Guamanians/Chamorros | 7.7 /100 | #221 | Tragic 9.0% |
| Peruvians | 7.3 /100 | #222 | Tragic 9.0% |
| Immigrants | Jordan | 6.9 /100 | #223 | Tragic 9.0% |
| Costa Ricans | 6.3 /100 | #224 | Tragic 9.1% |
| Navajo | 6.1 /100 | #225 | Tragic 9.1% |
| Immigrants | Bangladesh | 5.9 /100 | #226 | Tragic 9.1% |
| Samoans | 5.7 /100 | #227 | Tragic 9.1% |
| Kenyans | 5.4 /100 | #228 | Tragic 9.1% |
| Hispanics or Latinos | 5.0 /100 | #229 | Tragic 9.1% |
| Northern Europeans | 4.9 /100 | #230 | Tragic 9.1% |
| Immigrants | Central America | 4.9 /100 | #231 | Tragic 9.1% |
Demographics Similar to Apache by Unemployment Among Seniors over 75 years
In terms of unemployment among seniors over 75 years, the demographic groups most similar to Apache are German Russian (8.4%, a difference of 0.080%), Ghanaian (8.4%, a difference of 0.28%), Native Hawaiian (8.4%, a difference of 0.31%), Honduran (8.4%, a difference of 0.36%), and Belizean (8.4%, a difference of 0.37%).
| Demographics | Rating | Rank | Unemployment Among Seniors over 75 years |
| Immigrants | Nepal | 96.9 /100 | #123 | Exceptional 8.3% |
| Thais | 96.8 /100 | #124 | Exceptional 8.3% |
| Immigrants | Moldova | 96.7 /100 | #125 | Exceptional 8.3% |
| Belizeans | 96.3 /100 | #126 | Exceptional 8.4% |
| Hondurans | 96.2 /100 | #127 | Exceptional 8.4% |
| Native Hawaiians | 96.1 /100 | #128 | Exceptional 8.4% |
| Ghanaians | 96.0 /100 | #129 | Exceptional 8.4% |
| Apache | 95.2 /100 | #130 | Exceptional 8.4% |
| German Russians | 94.9 /100 | #131 | Exceptional 8.4% |
| Chileans | 93.8 /100 | #132 | Exceptional 8.4% |
| Serbians | 93.7 /100 | #133 | Exceptional 8.4% |
| Immigrants | Czechoslovakia | 93.4 /100 | #134 | Exceptional 8.4% |
| Haitians | 91.4 /100 | #135 | Exceptional 8.5% |
| Immigrants | Trinidad and Tobago | 90.8 /100 | #136 | Exceptional 8.5% |
| Immigrants | Kuwait | 90.5 /100 | #137 | Exceptional 8.5% |