Costa Rican vs Alsatian Unemployment Among Ages 35 to 44 years
COMPARE
Costa Rican
Alsatian
Unemployment Among Ages 35 to 44 years
Unemployment Among Ages 35 to 44 years Comparison
Costa Ricans
Alsatians
4.7%
UNEMPLOYMENT AMONG AGES 35 TO 44 YEARS
59.6/ 100
METRIC RATING
162nd/ 347
METRIC RANK
5.2%
UNEMPLOYMENT AMONG AGES 35 TO 44 YEARS
0.2/ 100
METRIC RATING
248th/ 347
METRIC RANK
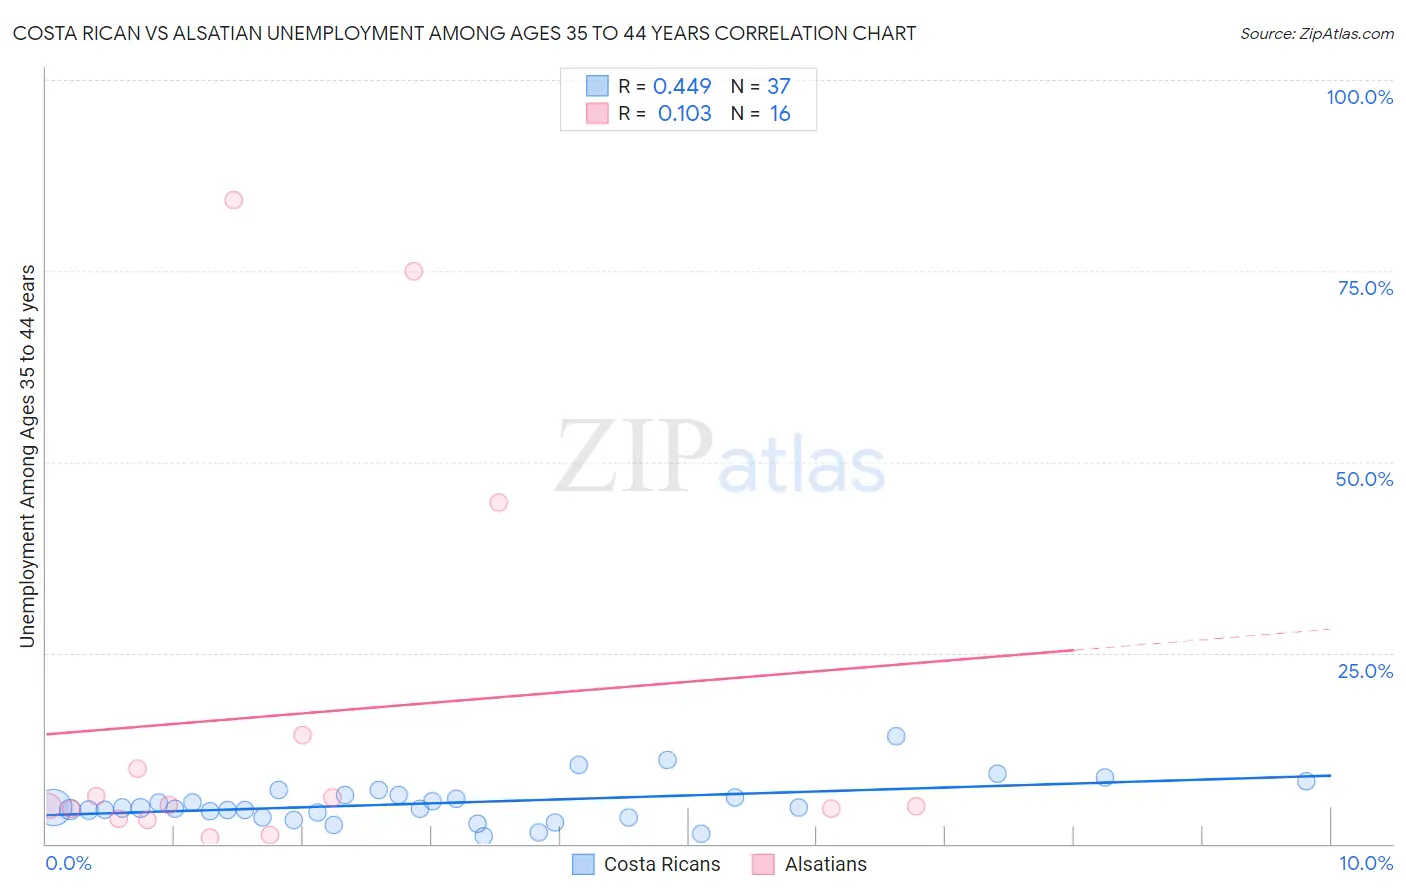
Costa Rican vs Alsatian Unemployment Among Ages 35 to 44 years Correlation Chart
The statistical analysis conducted on geographies consisting of 250,693,311 people shows a moderate positive correlation between the proportion of Costa Ricans and unemployment rate among population between the ages 35 and 44 in the United States with a correlation coefficient (R) of 0.449 and weighted average of 4.7%. Similarly, the statistical analysis conducted on geographies consisting of 82,111,994 people shows a poor positive correlation between the proportion of Alsatians and unemployment rate among population between the ages 35 and 44 in the United States with a correlation coefficient (R) of 0.103 and weighted average of 5.2%, a difference of 11.4%.
Unemployment Among Ages 35 to 44 years Correlation Summary
| Measurement | Costa Rican | Alsatian |
| Minimum | 0.95% | 0.90% |
| Maximum | 14.0% | 84.3% |
| Range | 13.1% | 83.4% |
| Mean | 5.3% | 17.0% |
| Median | 4.7% | 5.0% |
| Interquartile 25% (IQ1) | 3.8% | 3.9% |
| Interquartile 75% (IQ3) | 6.4% | 12.1% |
| Interquartile Range (IQR) | 2.6% | 8.1% |
| Standard Deviation (Sample) | 2.7% | 26.6% |
| Standard Deviation (Population) | 2.7% | 25.7% |
Similar Demographics by Unemployment Among Ages 35 to 44 years
Demographics Similar to Costa Ricans by Unemployment Among Ages 35 to 44 years
In terms of unemployment among ages 35 to 44 years, the demographic groups most similar to Costa Ricans are South African (4.7%, a difference of 0.080%), Celtic (4.7%, a difference of 0.15%), Immigrants from Morocco (4.7%, a difference of 0.18%), German Russian (4.7%, a difference of 0.18%), and Hungarian (4.6%, a difference of 0.22%).
| Demographics | Rating | Rank | Unemployment Among Ages 35 to 44 years |
| Whites/Caucasians | 64.9 /100 | #155 | Good 4.6% |
| South Americans | 63.7 /100 | #156 | Good 4.6% |
| Immigrants | Belarus | 63.4 /100 | #157 | Good 4.6% |
| Immigrants | Iran | 63.1 /100 | #158 | Good 4.6% |
| Albanians | 63.0 /100 | #159 | Good 4.6% |
| Hungarians | 62.6 /100 | #160 | Good 4.6% |
| Celtics | 61.7 /100 | #161 | Good 4.7% |
| Costa Ricans | 59.6 /100 | #162 | Average 4.7% |
| South Africans | 58.5 /100 | #163 | Average 4.7% |
| Immigrants | Morocco | 57.2 /100 | #164 | Average 4.7% |
| German Russians | 57.2 /100 | #165 | Average 4.7% |
| French | 55.6 /100 | #166 | Average 4.7% |
| Peruvians | 54.4 /100 | #167 | Average 4.7% |
| Arabs | 53.1 /100 | #168 | Average 4.7% |
| Pennsylvania Germans | 53.0 /100 | #169 | Average 4.7% |
Demographics Similar to Alsatians by Unemployment Among Ages 35 to 44 years
In terms of unemployment among ages 35 to 44 years, the demographic groups most similar to Alsatians are Immigrants from Liberia (5.2%, a difference of 0.030%), Immigrants from El Salvador (5.2%, a difference of 0.060%), Immigrants from Somalia (5.2%, a difference of 0.50%), Comanche (5.2%, a difference of 0.50%), and Armenian (5.2%, a difference of 0.63%).
| Demographics | Rating | Rank | Unemployment Among Ages 35 to 44 years |
| Immigrants | Honduras | 0.6 /100 | #241 | Tragic 5.1% |
| Delaware | 0.5 /100 | #242 | Tragic 5.1% |
| Salvadorans | 0.4 /100 | #243 | Tragic 5.1% |
| Guatemalans | 0.4 /100 | #244 | Tragic 5.1% |
| Bahamians | 0.4 /100 | #245 | Tragic 5.2% |
| Immigrants | Guatemala | 0.4 /100 | #246 | Tragic 5.2% |
| Immigrants | Somalia | 0.3 /100 | #247 | Tragic 5.2% |
| Alsatians | 0.2 /100 | #248 | Tragic 5.2% |
| Immigrants | Liberia | 0.2 /100 | #249 | Tragic 5.2% |
| Immigrants | El Salvador | 0.2 /100 | #250 | Tragic 5.2% |
| Comanche | 0.2 /100 | #251 | Tragic 5.2% |
| Armenians | 0.2 /100 | #252 | Tragic 5.2% |
| Mexican American Indians | 0.2 /100 | #253 | Tragic 5.2% |
| Immigrants | Bahamas | 0.2 /100 | #254 | Tragic 5.2% |
| Cherokee | 0.2 /100 | #255 | Tragic 5.2% |