Comanche vs Senegalese Male Unemployment
COMPARE
Comanche
Senegalese
Male Unemployment
Male Unemployment Comparison
Comanche
Senegalese
5.8%
MALE UNEMPLOYMENT
0.2/ 100
METRIC RATING
256th/ 347
METRIC RANK
6.4%
MALE UNEMPLOYMENT
0.0/ 100
METRIC RATING
294th/ 347
METRIC RANK
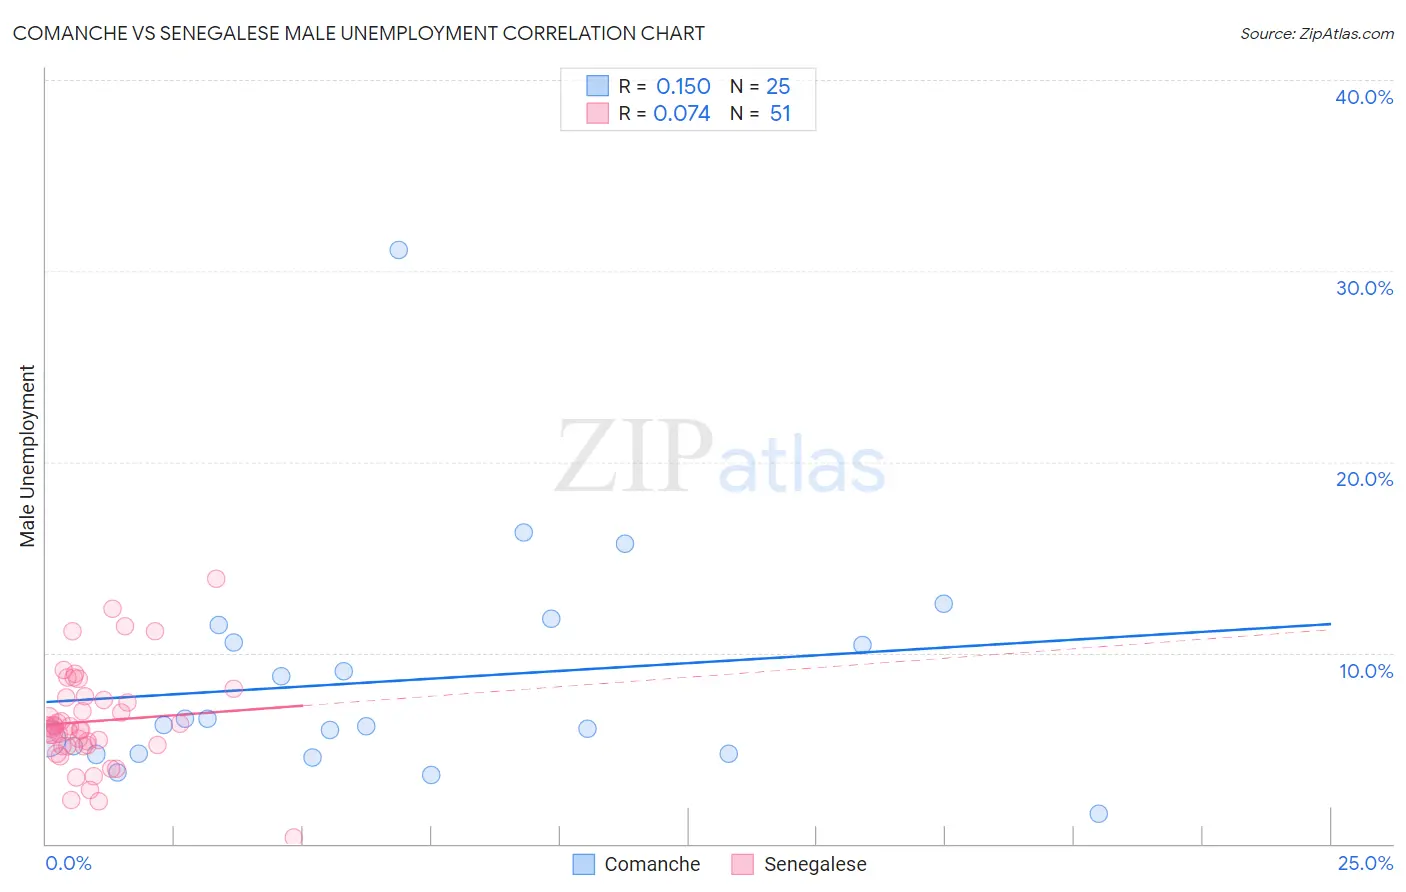
Comanche vs Senegalese Male Unemployment Correlation Chart
The statistical analysis conducted on geographies consisting of 109,543,085 people shows a poor positive correlation between the proportion of Comanche and unemployment rate among males in the United States with a correlation coefficient (R) of 0.150 and weighted average of 5.8%. Similarly, the statistical analysis conducted on geographies consisting of 78,095,938 people shows a slight positive correlation between the proportion of Senegalese and unemployment rate among males in the United States with a correlation coefficient (R) of 0.074 and weighted average of 6.4%, a difference of 11.3%.
Male Unemployment Correlation Summary
| Measurement | Comanche | Senegalese |
| Minimum | 1.6% | 0.30% |
| Maximum | 31.1% | 13.9% |
| Range | 29.5% | 13.6% |
| Mean | 8.5% | 6.4% |
| Median | 6.2% | 6.0% |
| Interquartile 25% (IQ1) | 4.7% | 5.1% |
| Interquartile 75% (IQ3) | 11.0% | 7.7% |
| Interquartile Range (IQR) | 6.3% | 2.6% |
| Standard Deviation (Sample) | 6.0% | 2.6% |
| Standard Deviation (Population) | 5.9% | 2.6% |
Similar Demographics by Male Unemployment
Demographics Similar to Comanche by Male Unemployment
In terms of male unemployment, the demographic groups most similar to Comanche are Kiowa (5.8%, a difference of 0.080%), Hispanic or Latino (5.8%, a difference of 0.17%), Japanese (5.8%, a difference of 0.18%), Dutch West Indian (5.8%, a difference of 0.30%), and Mexican American Indian (5.8%, a difference of 0.35%).
| Demographics | Rating | Rank | Male Unemployment |
| Cree | 0.4 /100 | #249 | Tragic 5.7% |
| Immigrants | Bahamas | 0.4 /100 | #250 | Tragic 5.7% |
| Spanish Americans | 0.3 /100 | #251 | Tragic 5.7% |
| Mexicans | 0.2 /100 | #252 | Tragic 5.8% |
| Mexican American Indians | 0.2 /100 | #253 | Tragic 5.8% |
| Japanese | 0.2 /100 | #254 | Tragic 5.8% |
| Kiowa | 0.2 /100 | #255 | Tragic 5.8% |
| Comanche | 0.2 /100 | #256 | Tragic 5.8% |
| Hispanics or Latinos | 0.1 /100 | #257 | Tragic 5.8% |
| Dutch West Indians | 0.1 /100 | #258 | Tragic 5.8% |
| Cajuns | 0.1 /100 | #259 | Tragic 5.8% |
| Immigrants | Central America | 0.1 /100 | #260 | Tragic 5.8% |
| Liberians | 0.1 /100 | #261 | Tragic 5.8% |
| Immigrants | Portugal | 0.1 /100 | #262 | Tragic 5.9% |
| Immigrants | Latin America | 0.1 /100 | #263 | Tragic 5.9% |
Demographics Similar to Senegalese by Male Unemployment
In terms of male unemployment, the demographic groups most similar to Senegalese are Haitian (6.4%, a difference of 0.11%), Nepalese (6.4%, a difference of 0.14%), Immigrants from the Azores (6.4%, a difference of 0.48%), Belizean (6.5%, a difference of 0.85%), and U.S. Virgin Islander (6.4%, a difference of 1.0%).
| Demographics | Rating | Rank | Male Unemployment |
| Central American Indians | 0.0 /100 | #287 | Tragic 6.3% |
| Immigrants | Senegal | 0.0 /100 | #288 | Tragic 6.3% |
| Immigrants | Caribbean | 0.0 /100 | #289 | Tragic 6.3% |
| U.S. Virgin Islanders | 0.0 /100 | #290 | Tragic 6.4% |
| Immigrants | Azores | 0.0 /100 | #291 | Tragic 6.4% |
| Nepalese | 0.0 /100 | #292 | Tragic 6.4% |
| Haitians | 0.0 /100 | #293 | Tragic 6.4% |
| Senegalese | 0.0 /100 | #294 | Tragic 6.4% |
| Belizeans | 0.0 /100 | #295 | Tragic 6.5% |
| Immigrants | Haiti | 0.0 /100 | #296 | Tragic 6.5% |
| Chippewa | 0.0 /100 | #297 | Tragic 6.6% |
| Jamaicans | 0.0 /100 | #298 | Tragic 6.6% |
| Immigrants | Bangladesh | 0.0 /100 | #299 | Tragic 6.6% |
| Vietnamese | 0.0 /100 | #300 | Tragic 6.6% |
| Immigrants | Belize | 0.0 /100 | #301 | Tragic 6.6% |