Comanche vs Immigrants from Panama Female Unemployment
COMPARE
Comanche
Immigrants from Panama
Female Unemployment
Female Unemployment Comparison
Comanche
Immigrants from Panama
5.4%
FEMALE UNEMPLOYMENT
10.0/ 100
METRIC RATING
216th/ 347
METRIC RANK
5.5%
FEMALE UNEMPLOYMENT
3.2/ 100
METRIC RATING
237th/ 347
METRIC RANK
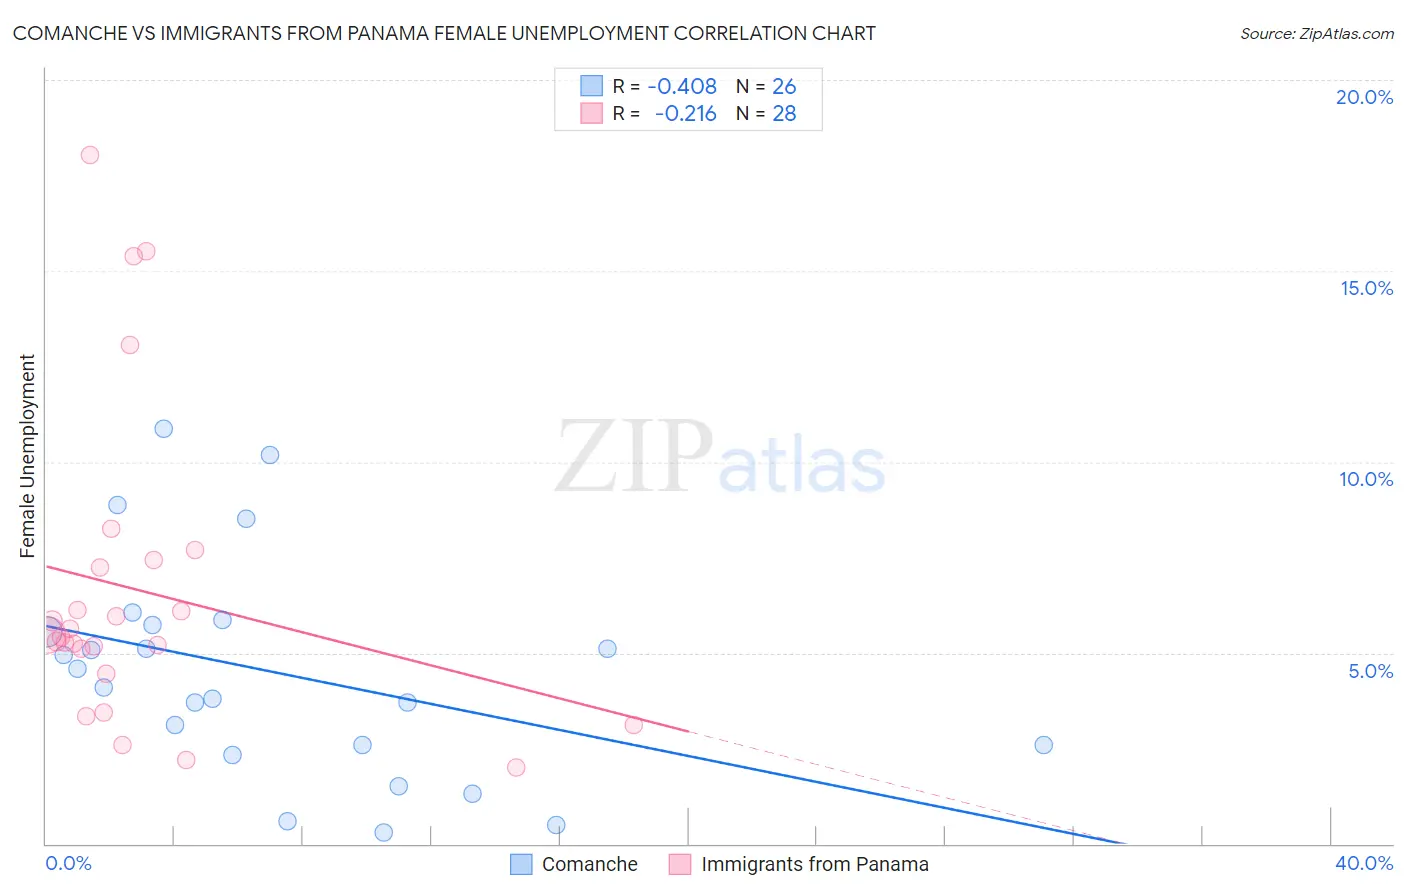
Comanche vs Immigrants from Panama Female Unemployment Correlation Chart
The statistical analysis conducted on geographies consisting of 109,454,085 people shows a moderate negative correlation between the proportion of Comanche and unemploymnet rate among females in the United States with a correlation coefficient (R) of -0.408 and weighted average of 5.4%. Similarly, the statistical analysis conducted on geographies consisting of 220,928,919 people shows a weak negative correlation between the proportion of Immigrants from Panama and unemploymnet rate among females in the United States with a correlation coefficient (R) of -0.216 and weighted average of 5.5%, a difference of 1.8%.
Female Unemployment Correlation Summary
| Measurement | Comanche | Immigrants from Panama |
| Minimum | 0.30% | 2.0% |
| Maximum | 10.9% | 18.0% |
| Range | 10.6% | 16.0% |
| Mean | 4.5% | 6.6% |
| Median | 4.3% | 5.4% |
| Interquartile 25% (IQ1) | 2.6% | 4.8% |
| Interquartile 75% (IQ3) | 5.7% | 7.3% |
| Interquartile Range (IQR) | 3.1% | 2.6% |
| Standard Deviation (Sample) | 2.8% | 4.1% |
| Standard Deviation (Population) | 2.8% | 4.0% |
Similar Demographics by Female Unemployment
Demographics Similar to Comanche by Female Unemployment
In terms of female unemployment, the demographic groups most similar to Comanche are Immigrants from Nicaragua (5.4%, a difference of 0.020%), Seminole (5.4%, a difference of 0.040%), Peruvian (5.4%, a difference of 0.070%), Samoan (5.4%, a difference of 0.090%), and Bermudan (5.4%, a difference of 0.17%).
| Demographics | Rating | Rank | Female Unemployment |
| Koreans | 13.4 /100 | #209 | Poor 5.4% |
| Choctaw | 12.3 /100 | #210 | Poor 5.4% |
| Ottawa | 11.6 /100 | #211 | Poor 5.4% |
| Uruguayans | 11.4 /100 | #212 | Poor 5.4% |
| Samoans | 10.6 /100 | #213 | Poor 5.4% |
| Seminole | 10.3 /100 | #214 | Poor 5.4% |
| Immigrants | Nicaragua | 10.2 /100 | #215 | Poor 5.4% |
| Comanche | 10.0 /100 | #216 | Poor 5.4% |
| Peruvians | 9.6 /100 | #217 | Tragic 5.4% |
| Bermudans | 9.0 /100 | #218 | Tragic 5.4% |
| South Americans | 8.6 /100 | #219 | Tragic 5.4% |
| Immigrants | Africa | 8.5 /100 | #220 | Tragic 5.4% |
| Brazilians | 7.3 /100 | #221 | Tragic 5.5% |
| Nicaraguans | 7.2 /100 | #222 | Tragic 5.5% |
| Delaware | 7.2 /100 | #223 | Tragic 5.5% |
Demographics Similar to Immigrants from Panama by Female Unemployment
In terms of female unemployment, the demographic groups most similar to Immigrants from Panama are Immigrants from Cambodia (5.5%, a difference of 0.020%), Sierra Leonean (5.5%, a difference of 0.020%), Immigrants from Lebanon (5.5%, a difference of 0.060%), Immigrants from Iran (5.5%, a difference of 0.060%), and Moroccan (5.5%, a difference of 0.080%).
| Demographics | Rating | Rank | Female Unemployment |
| Immigrants | Uruguay | 4.7 /100 | #230 | Tragic 5.5% |
| Immigrants | Iraq | 3.9 /100 | #231 | Tragic 5.5% |
| Liberians | 3.9 /100 | #232 | Tragic 5.5% |
| Moroccans | 3.4 /100 | #233 | Tragic 5.5% |
| Immigrants | Lebanon | 3.3 /100 | #234 | Tragic 5.5% |
| Immigrants | Iran | 3.3 /100 | #235 | Tragic 5.5% |
| Immigrants | Cambodia | 3.3 /100 | #236 | Tragic 5.5% |
| Immigrants | Panama | 3.2 /100 | #237 | Tragic 5.5% |
| Sierra Leoneans | 3.2 /100 | #238 | Tragic 5.5% |
| Aleuts | 3.0 /100 | #239 | Tragic 5.5% |
| Immigrants | South America | 2.9 /100 | #240 | Tragic 5.5% |
| South American Indians | 2.8 /100 | #241 | Tragic 5.5% |
| Marshallese | 2.3 /100 | #242 | Tragic 5.6% |
| Spanish Americans | 2.2 /100 | #243 | Tragic 5.6% |
| Immigrants | Liberia | 1.5 /100 | #244 | Tragic 5.6% |