Comanche vs Immigrants from Iran Unemployment Among Ages 16 to 19 years
COMPARE
Comanche
Immigrants from Iran
Unemployment Among Ages 16 to 19 years
Unemployment Among Ages 16 to 19 years Comparison
Comanche
Immigrants from Iran
20.2%
UNEMPLOYMENT AMONG AGES 16 TO 19 YEARS
0.0/ 100
METRIC RATING
292nd/ 347
METRIC RANK
18.0%
UNEMPLOYMENT AMONG AGES 16 TO 19 YEARS
10.7/ 100
METRIC RATING
222nd/ 347
METRIC RANK
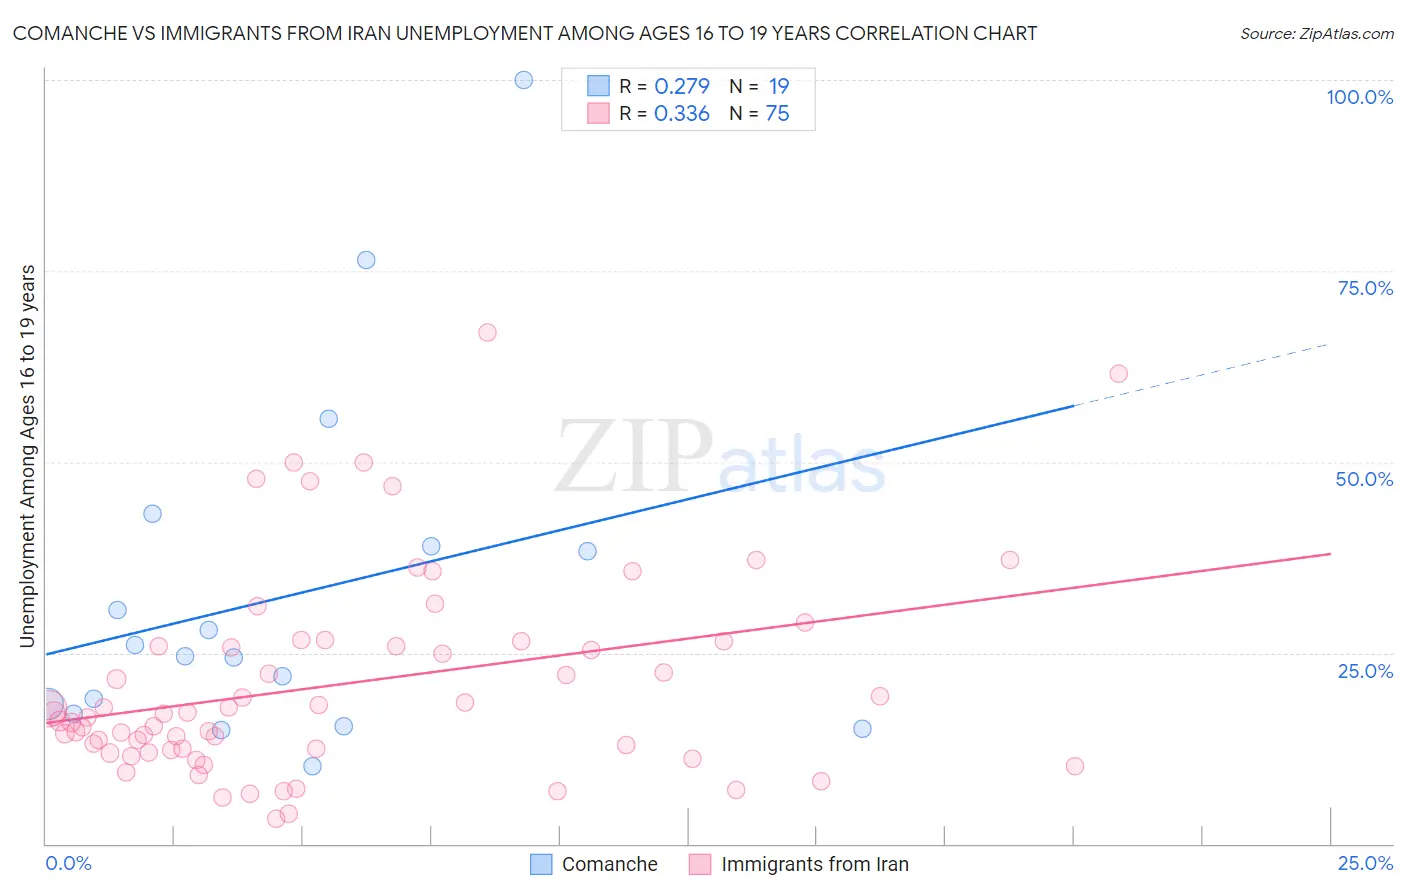
Comanche vs Immigrants from Iran Unemployment Among Ages 16 to 19 years Correlation Chart
The statistical analysis conducted on geographies consisting of 107,292,450 people shows a weak positive correlation between the proportion of Comanche and unemployment rate among population between the ages 16 and 19 in the United States with a correlation coefficient (R) of 0.279 and weighted average of 20.2%. Similarly, the statistical analysis conducted on geographies consisting of 269,382,080 people shows a mild positive correlation between the proportion of Immigrants from Iran and unemployment rate among population between the ages 16 and 19 in the United States with a correlation coefficient (R) of 0.336 and weighted average of 18.0%, a difference of 12.4%.
Unemployment Among Ages 16 to 19 years Correlation Summary
| Measurement | Comanche | Immigrants from Iran |
| Minimum | 10.1% | 3.2% |
| Maximum | 100.0% | 67.0% |
| Range | 89.9% | 63.8% |
| Mean | 32.5% | 20.9% |
| Median | 24.6% | 17.1% |
| Interquartile 25% (IQ1) | 17.0% | 12.2% |
| Interquartile 75% (IQ3) | 38.9% | 26.5% |
| Interquartile Range (IQR) | 21.9% | 14.2% |
| Standard Deviation (Sample) | 23.0% | 13.3% |
| Standard Deviation (Population) | 22.4% | 13.2% |
Similar Demographics by Unemployment Among Ages 16 to 19 years
Demographics Similar to Comanche by Unemployment Among Ages 16 to 19 years
In terms of unemployment among ages 16 to 19 years, the demographic groups most similar to Comanche are Immigrants from Bahamas (20.4%, a difference of 0.63%), Immigrants from Haiti (20.4%, a difference of 0.89%), Central American Indian (20.4%, a difference of 0.94%), Immigrants from Yemen (20.0%, a difference of 1.0%), and Armenian (20.5%, a difference of 1.2%).
| Demographics | Rating | Rank | Unemployment Among Ages 16 to 19 years |
| Ghanaians | 0.0 /100 | #285 | Tragic 19.8% |
| Bahamians | 0.0 /100 | #286 | Tragic 19.8% |
| Immigrants | Ghana | 0.0 /100 | #287 | Tragic 19.8% |
| Immigrants | Azores | 0.0 /100 | #288 | Tragic 19.8% |
| Pueblo | 0.0 /100 | #289 | Tragic 19.8% |
| Immigrants | Sierra Leone | 0.0 /100 | #290 | Tragic 20.0% |
| Immigrants | Yemen | 0.0 /100 | #291 | Tragic 20.0% |
| Comanche | 0.0 /100 | #292 | Tragic 20.2% |
| Immigrants | Bahamas | 0.0 /100 | #293 | Tragic 20.4% |
| Immigrants | Haiti | 0.0 /100 | #294 | Tragic 20.4% |
| Central American Indians | 0.0 /100 | #295 | Tragic 20.4% |
| Armenians | 0.0 /100 | #296 | Tragic 20.5% |
| Alsatians | 0.0 /100 | #297 | Tragic 20.5% |
| Haitians | 0.0 /100 | #298 | Tragic 20.5% |
| Immigrants | Uzbekistan | 0.0 /100 | #299 | Tragic 20.5% |
Demographics Similar to Immigrants from Iran by Unemployment Among Ages 16 to 19 years
In terms of unemployment among ages 16 to 19 years, the demographic groups most similar to Immigrants from Iran are Immigrants from Western Asia (18.0%, a difference of 0.060%), Immigrants from Albania (18.0%, a difference of 0.090%), Immigrants from Spain (18.0%, a difference of 0.090%), Immigrants from Africa (18.0%, a difference of 0.15%), and Immigrants from Argentina (18.0%, a difference of 0.21%).
| Demographics | Rating | Rank | Unemployment Among Ages 16 to 19 years |
| Immigrants | Syria | 13.3 /100 | #215 | Poor 18.0% |
| Immigrants | Kazakhstan | 13.0 /100 | #216 | Poor 18.0% |
| South American Indians | 13.0 /100 | #217 | Poor 18.0% |
| Immigrants | Argentina | 12.5 /100 | #218 | Poor 18.0% |
| Immigrants | Africa | 12.0 /100 | #219 | Poor 18.0% |
| Immigrants | Albania | 11.4 /100 | #220 | Poor 18.0% |
| Immigrants | Spain | 11.4 /100 | #221 | Poor 18.0% |
| Immigrants | Iran | 10.7 /100 | #222 | Poor 18.0% |
| Immigrants | Western Asia | 10.2 /100 | #223 | Poor 18.0% |
| Immigrants | Serbia | 8.3 /100 | #224 | Tragic 18.1% |
| Immigrants | Chile | 7.5 /100 | #225 | Tragic 18.1% |
| Immigrants | Belgium | 7.3 /100 | #226 | Tragic 18.1% |
| Immigrants | Liberia | 7.1 /100 | #227 | Tragic 18.1% |
| Immigrants | Greece | 7.1 /100 | #228 | Tragic 18.1% |
| Albanians | 5.8 /100 | #229 | Tragic 18.2% |