Comanche vs Immigrants from Hong Kong Unemployment Among Ages 30 to 34 years
COMPARE
Comanche
Immigrants from Hong Kong
Unemployment Among Ages 30 to 34 years
Unemployment Among Ages 30 to 34 years Comparison
Comanche
Immigrants from Hong Kong
6.3%
UNEMPLOYMENT AMONG AGES 30 TO 34 YEARS
0.0/ 100
METRIC RATING
271st/ 347
METRIC RANK
5.0%
UNEMPLOYMENT AMONG AGES 30 TO 34 YEARS
98.8/ 100
METRIC RATING
42nd/ 347
METRIC RANK
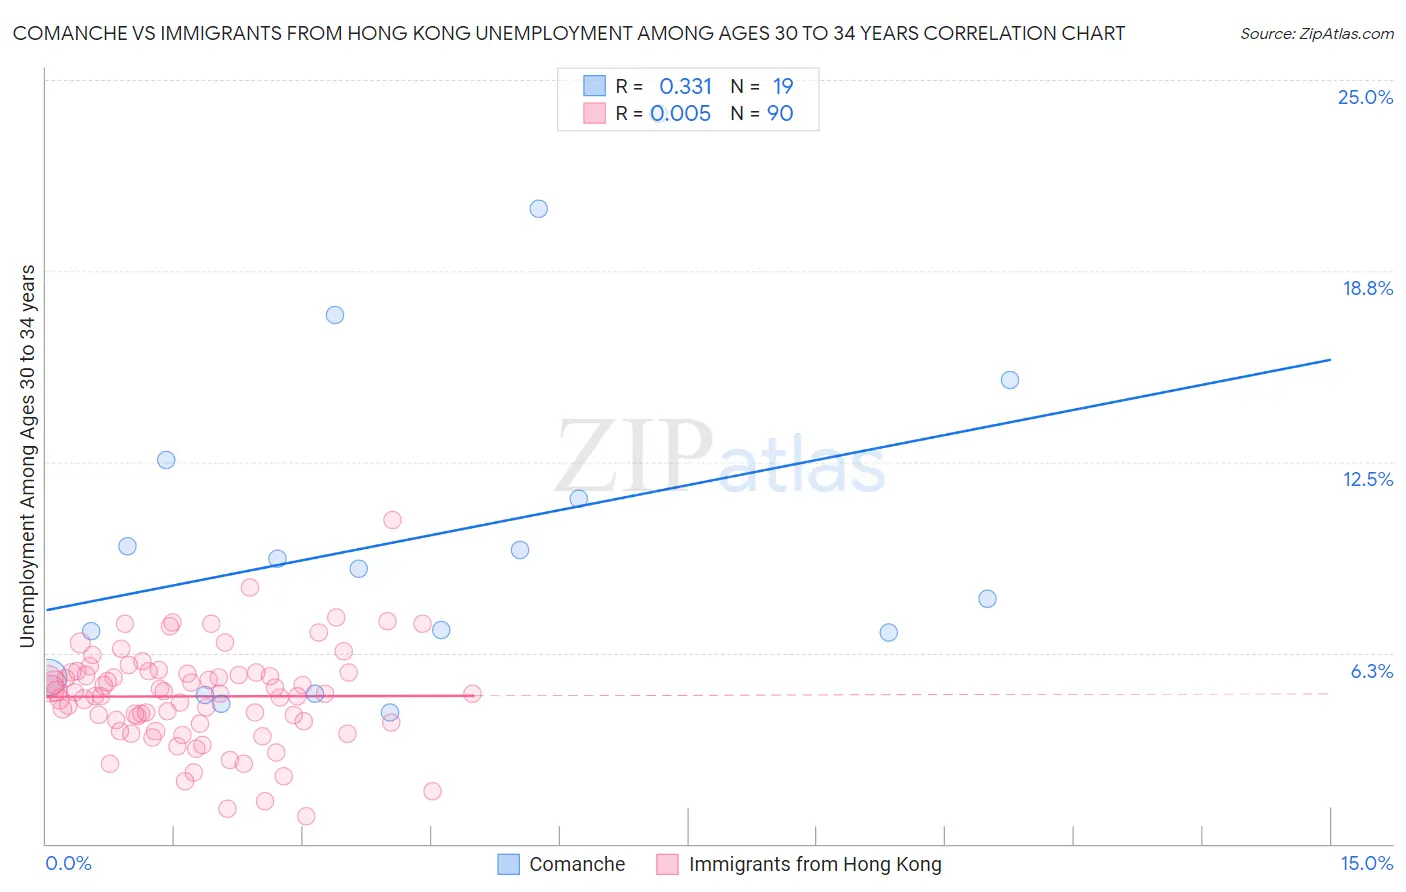
Comanche vs Immigrants from Hong Kong Unemployment Among Ages 30 to 34 years Correlation Chart
The statistical analysis conducted on geographies consisting of 107,264,456 people shows a mild positive correlation between the proportion of Comanche and unemployment rate among population between the ages 30 and 34 in the United States with a correlation coefficient (R) of 0.331 and weighted average of 6.3%. Similarly, the statistical analysis conducted on geographies consisting of 245,493,498 people shows no correlation between the proportion of Immigrants from Hong Kong and unemployment rate among population between the ages 30 and 34 in the United States with a correlation coefficient (R) of 0.005 and weighted average of 5.0%, a difference of 24.3%.
Unemployment Among Ages 30 to 34 years Correlation Summary
| Measurement | Comanche | Immigrants from Hong Kong |
| Minimum | 4.3% | 0.90% |
| Maximum | 23.9% | 10.6% |
| Range | 19.6% | 9.7% |
| Mean | 10.1% | 4.8% |
| Median | 9.0% | 4.9% |
| Interquartile 25% (IQ1) | 5.4% | 4.0% |
| Interquartile 75% (IQ3) | 12.6% | 5.6% |
| Interquartile Range (IQR) | 7.1% | 1.6% |
| Standard Deviation (Sample) | 5.6% | 1.6% |
| Standard Deviation (Population) | 5.5% | 1.6% |
Similar Demographics by Unemployment Among Ages 30 to 34 years
Demographics Similar to Comanche by Unemployment Among Ages 30 to 34 years
In terms of unemployment among ages 30 to 34 years, the demographic groups most similar to Comanche are Blackfeet (6.3%, a difference of 0.11%), Ottawa (6.3%, a difference of 0.12%), U.S. Virgin Islander (6.3%, a difference of 0.13%), Immigrants from Senegal (6.3%, a difference of 0.19%), and French American Indian (6.3%, a difference of 0.20%).
| Demographics | Rating | Rank | Unemployment Among Ages 30 to 34 years |
| Chickasaw | 0.0 /100 | #264 | Tragic 6.2% |
| Americans | 0.0 /100 | #265 | Tragic 6.2% |
| Seminole | 0.0 /100 | #266 | Tragic 6.2% |
| Immigrants | Mexico | 0.0 /100 | #267 | Tragic 6.2% |
| Immigrants | Haiti | 0.0 /100 | #268 | Tragic 6.2% |
| French American Indians | 0.0 /100 | #269 | Tragic 6.3% |
| Immigrants | Senegal | 0.0 /100 | #270 | Tragic 6.3% |
| Comanche | 0.0 /100 | #271 | Tragic 6.3% |
| Blackfeet | 0.0 /100 | #272 | Tragic 6.3% |
| Ottawa | 0.0 /100 | #273 | Tragic 6.3% |
| U.S. Virgin Islanders | 0.0 /100 | #274 | Tragic 6.3% |
| Ecuadorians | 0.0 /100 | #275 | Tragic 6.3% |
| Pennsylvania Germans | 0.0 /100 | #276 | Tragic 6.3% |
| Immigrants | Ecuador | 0.0 /100 | #277 | Tragic 6.3% |
| Osage | 0.0 /100 | #278 | Tragic 6.3% |
Demographics Similar to Immigrants from Hong Kong by Unemployment Among Ages 30 to 34 years
In terms of unemployment among ages 30 to 34 years, the demographic groups most similar to Immigrants from Hong Kong are Soviet Union (5.0%, a difference of 0.10%), Immigrants from Vietnam (5.0%, a difference of 0.18%), Immigrants from Eastern Africa (5.0%, a difference of 0.18%), Immigrants from Belgium (5.1%, a difference of 0.25%), and Fijian (5.0%, a difference of 0.27%).
| Demographics | Rating | Rank | Unemployment Among Ages 30 to 34 years |
| Immigrants | Ethiopia | 99.2 /100 | #35 | Exceptional 5.0% |
| Czechs | 99.2 /100 | #36 | Exceptional 5.0% |
| Immigrants | Turkey | 99.0 /100 | #37 | Exceptional 5.0% |
| Sri Lankans | 99.0 /100 | #38 | Exceptional 5.0% |
| Fijians | 99.0 /100 | #39 | Exceptional 5.0% |
| Immigrants | Vietnam | 98.9 /100 | #40 | Exceptional 5.0% |
| Immigrants | Eastern Africa | 98.9 /100 | #41 | Exceptional 5.0% |
| Immigrants | Hong Kong | 98.8 /100 | #42 | Exceptional 5.0% |
| Soviet Union | 98.8 /100 | #43 | Exceptional 5.0% |
| Immigrants | Belgium | 98.7 /100 | #44 | Exceptional 5.1% |
| Yugoslavians | 98.6 /100 | #45 | Exceptional 5.1% |
| Immigrants | Congo | 98.4 /100 | #46 | Exceptional 5.1% |
| Cypriots | 98.4 /100 | #47 | Exceptional 5.1% |
| Assyrians/Chaldeans/Syriacs | 98.4 /100 | #48 | Exceptional 5.1% |
| Immigrants | Malaysia | 98.3 /100 | #49 | Exceptional 5.1% |