Comanche vs Immigrants from Bulgaria Unemployment Among Youth under 25 years
COMPARE
Comanche
Immigrants from Bulgaria
Unemployment Among Youth under 25 years
Unemployment Among Youth under 25 years Comparison
Comanche
Immigrants from Bulgaria
11.8%
UNEMPLOYMENT AMONG YOUTH UNDER 25 YEARS
12.1/ 100
METRIC RATING
208th/ 347
METRIC RANK
11.2%
UNEMPLOYMENT AMONG YOUTH UNDER 25 YEARS
96.4/ 100
METRIC RATING
80th/ 347
METRIC RANK
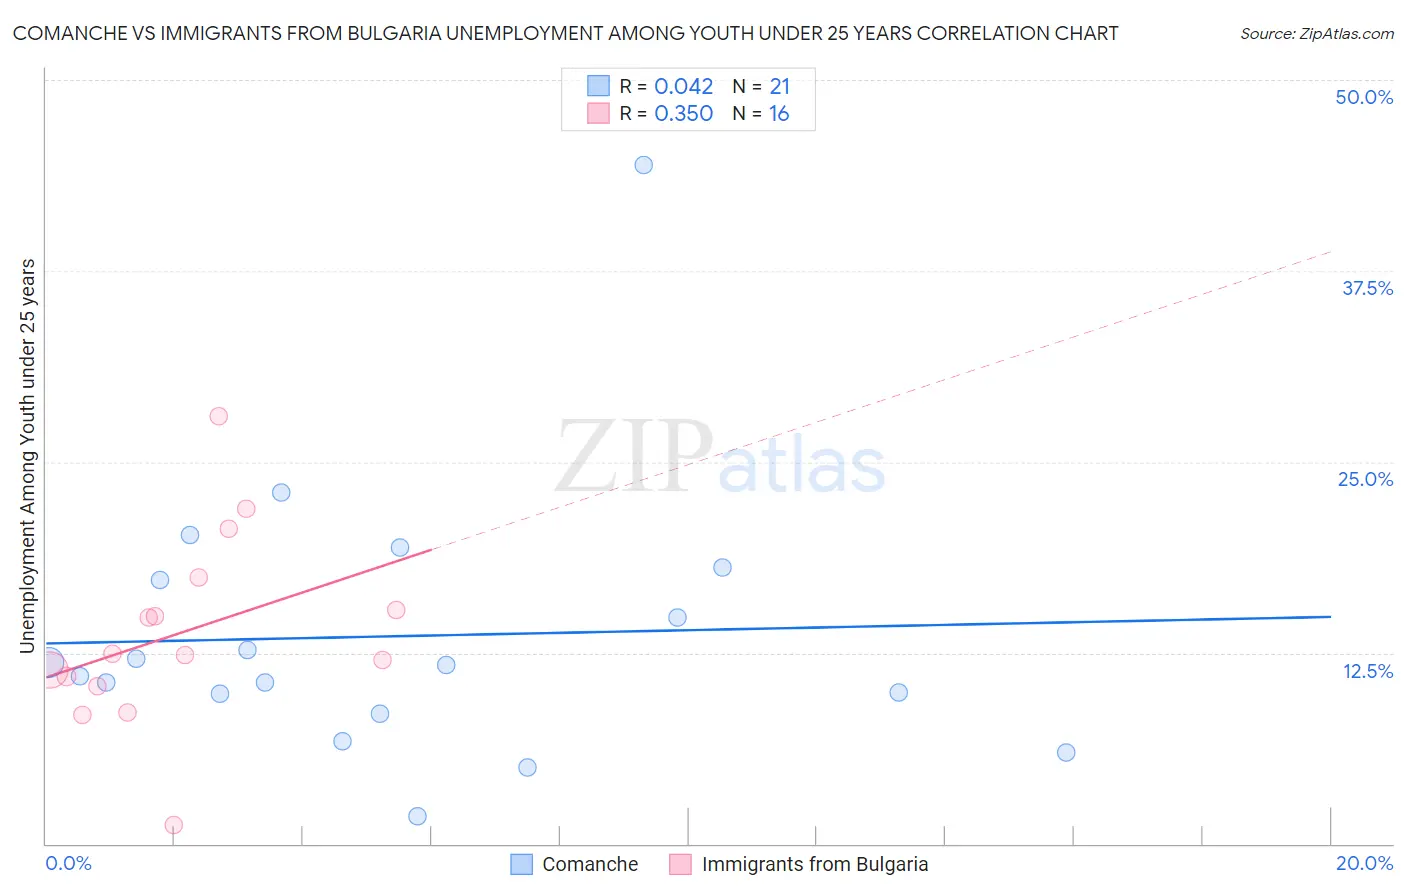
Comanche vs Immigrants from Bulgaria Unemployment Among Youth under 25 years Correlation Chart
The statistical analysis conducted on geographies consisting of 109,118,325 people shows no correlation between the proportion of Comanche and unemployment rate among youth under the age of 25 in the United States with a correlation coefficient (R) of 0.042 and weighted average of 11.8%. Similarly, the statistical analysis conducted on geographies consisting of 171,741,074 people shows a mild positive correlation between the proportion of Immigrants from Bulgaria and unemployment rate among youth under the age of 25 in the United States with a correlation coefficient (R) of 0.350 and weighted average of 11.2%, a difference of 5.6%.
Unemployment Among Youth under 25 years Correlation Summary
| Measurement | Comanche | Immigrants from Bulgaria |
| Minimum | 1.8% | 1.2% |
| Maximum | 44.4% | 28.0% |
| Range | 42.6% | 26.8% |
| Mean | 13.6% | 13.8% |
| Median | 11.7% | 12.4% |
| Interquartile 25% (IQ1) | 9.2% | 10.6% |
| Interquartile 75% (IQ3) | 17.7% | 16.4% |
| Interquartile Range (IQR) | 8.5% | 5.8% |
| Standard Deviation (Sample) | 8.8% | 6.2% |
| Standard Deviation (Population) | 8.6% | 6.0% |
Similar Demographics by Unemployment Among Youth under 25 years
Demographics Similar to Comanche by Unemployment Among Youth under 25 years
In terms of unemployment among youth under 25 years, the demographic groups most similar to Comanche are Immigrants from Southern Europe (11.8%, a difference of 0.020%), Immigrants from Pakistan (11.8%, a difference of 0.040%), Immigrants from Lebanon (11.8%, a difference of 0.080%), Peruvian (11.8%, a difference of 0.17%), and Assyrian/Chaldean/Syriac (11.9%, a difference of 0.23%).
| Demographics | Rating | Rank | Unemployment Among Youth under 25 years |
| Palestinians | 16.0 /100 | #201 | Poor 11.8% |
| Marshallese | 15.8 /100 | #202 | Poor 11.8% |
| Immigrants | Peru | 15.3 /100 | #203 | Poor 11.8% |
| Immigrants | Costa Rica | 15.2 /100 | #204 | Poor 11.8% |
| Peruvians | 14.0 /100 | #205 | Poor 11.8% |
| Immigrants | Pakistan | 12.6 /100 | #206 | Poor 11.8% |
| Immigrants | Southern Europe | 12.3 /100 | #207 | Poor 11.8% |
| Comanche | 12.1 /100 | #208 | Poor 11.8% |
| Immigrants | Lebanon | 11.3 /100 | #209 | Poor 11.8% |
| Assyrians/Chaldeans/Syriacs | 9.8 /100 | #210 | Tragic 11.9% |
| Immigrants | Philippines | 9.2 /100 | #211 | Tragic 11.9% |
| Colombians | 9.1 /100 | #212 | Tragic 11.9% |
| South Americans | 8.5 /100 | #213 | Tragic 11.9% |
| Costa Ricans | 8.2 /100 | #214 | Tragic 11.9% |
| Samoans | 7.4 /100 | #215 | Tragic 11.9% |
Demographics Similar to Immigrants from Bulgaria by Unemployment Among Youth under 25 years
In terms of unemployment among youth under 25 years, the demographic groups most similar to Immigrants from Bulgaria are Icelander (11.2%, a difference of 0.050%), Northern European (11.2%, a difference of 0.060%), Immigrants from Canada (11.2%, a difference of 0.080%), Immigrants from Nicaragua (11.2%, a difference of 0.090%), and Bolivian (11.2%, a difference of 0.11%).
| Demographics | Rating | Rank | Unemployment Among Youth under 25 years |
| Creek | 97.2 /100 | #73 | Exceptional 11.2% |
| New Zealanders | 97.2 /100 | #74 | Exceptional 11.2% |
| French | 97.1 /100 | #75 | Exceptional 11.2% |
| German Russians | 97.0 /100 | #76 | Exceptional 11.2% |
| Whites/Caucasians | 96.9 /100 | #77 | Exceptional 11.2% |
| Immigrants | Nicaragua | 96.7 /100 | #78 | Exceptional 11.2% |
| Immigrants | Canada | 96.7 /100 | #79 | Exceptional 11.2% |
| Immigrants | Bulgaria | 96.4 /100 | #80 | Exceptional 11.2% |
| Icelanders | 96.3 /100 | #81 | Exceptional 11.2% |
| Northern Europeans | 96.2 /100 | #82 | Exceptional 11.2% |
| Bolivians | 96.1 /100 | #83 | Exceptional 11.2% |
| French Canadians | 95.9 /100 | #84 | Exceptional 11.2% |
| Immigrants | South Central Asia | 95.9 /100 | #85 | Exceptional 11.2% |
| Immigrants | South Africa | 95.8 /100 | #86 | Exceptional 11.2% |
| Kenyans | 95.7 /100 | #87 | Exceptional 11.2% |