Colville vs Immigrants from Fiji Unemployment Among Ages 25 to 29 years
COMPARE
Colville
Immigrants from Fiji
Unemployment Among Ages 25 to 29 years
Unemployment Among Ages 25 to 29 years Comparison
Colville
Immigrants from Fiji
9.2%
UNEMPLOYMENT AMONG AGES 25 TO 29 YEARS
0.0/ 100
METRIC RATING
327th/ 347
METRIC RANK
7.4%
UNEMPLOYMENT AMONG AGES 25 TO 29 YEARS
0.1/ 100
METRIC RATING
265th/ 347
METRIC RANK
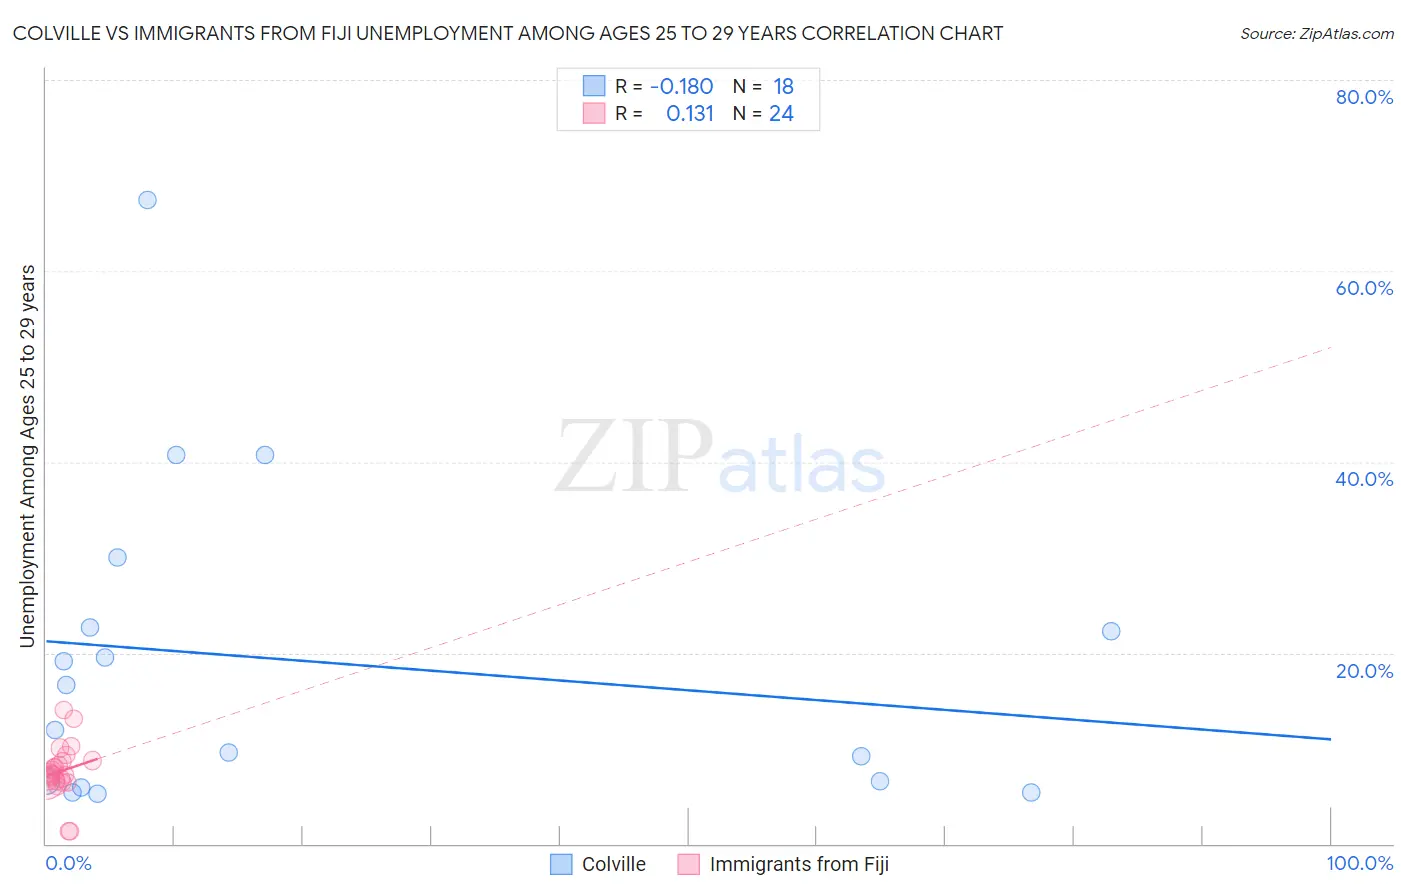
Colville vs Immigrants from Fiji Unemployment Among Ages 25 to 29 years Correlation Chart
The statistical analysis conducted on geographies consisting of 34,069,511 people shows a poor negative correlation between the proportion of Colville and unemployment rate among population between the ages 25 and 29 in the United States with a correlation coefficient (R) of -0.180 and weighted average of 9.2%. Similarly, the statistical analysis conducted on geographies consisting of 93,025,222 people shows a poor positive correlation between the proportion of Immigrants from Fiji and unemployment rate among population between the ages 25 and 29 in the United States with a correlation coefficient (R) of 0.131 and weighted average of 7.4%, a difference of 24.9%.
Unemployment Among Ages 25 to 29 years Correlation Summary
| Measurement | Colville | Immigrants from Fiji |
| Minimum | 5.3% | 1.3% |
| Maximum | 67.4% | 14.0% |
| Range | 62.1% | 12.7% |
| Mean | 19.1% | 7.6% |
| Median | 14.3% | 7.3% |
| Interquartile 25% (IQ1) | 6.5% | 6.5% |
| Interquartile 75% (IQ3) | 22.7% | 8.7% |
| Interquartile Range (IQR) | 16.2% | 2.1% |
| Standard Deviation (Sample) | 16.6% | 2.8% |
| Standard Deviation (Population) | 16.2% | 2.7% |
Similar Demographics by Unemployment Among Ages 25 to 29 years
Demographics Similar to Colville by Unemployment Among Ages 25 to 29 years
In terms of unemployment among ages 25 to 29 years, the demographic groups most similar to Colville are Shoshone (9.2%, a difference of 0.16%), Apache (9.5%, a difference of 2.6%), Aleut (9.7%, a difference of 4.9%), Yakama (8.8%, a difference of 5.5%), and Houma (8.7%, a difference of 6.0%).
| Demographics | Rating | Rank | Unemployment Among Ages 25 to 29 years |
| Blacks/African Americans | 0.0 /100 | #320 | Tragic 8.6% |
| Immigrants | Dominican Republic | 0.0 /100 | #321 | Tragic 8.6% |
| Tlingit-Haida | 0.0 /100 | #322 | Tragic 8.7% |
| Dominicans | 0.0 /100 | #323 | Tragic 8.7% |
| Houma | 0.0 /100 | #324 | Tragic 8.7% |
| Yakama | 0.0 /100 | #325 | Tragic 8.8% |
| Shoshone | 0.0 /100 | #326 | Tragic 9.2% |
| Colville | 0.0 /100 | #327 | Tragic 9.2% |
| Apache | 0.0 /100 | #328 | Tragic 9.5% |
| Aleuts | 0.0 /100 | #329 | Tragic 9.7% |
| Natives/Alaskans | 0.0 /100 | #330 | Tragic 9.8% |
| Alaska Natives | 0.0 /100 | #331 | Tragic 10.2% |
| Pueblo | 0.0 /100 | #332 | Tragic 10.4% |
| Alaskan Athabascans | 0.0 /100 | #333 | Tragic 10.8% |
| Yuman | 0.0 /100 | #334 | Tragic 11.0% |
Demographics Similar to Immigrants from Fiji by Unemployment Among Ages 25 to 29 years
In terms of unemployment among ages 25 to 29 years, the demographic groups most similar to Immigrants from Fiji are Immigrants from Western Africa (7.4%, a difference of 0.070%), Paiute (7.4%, a difference of 0.14%), Kiowa (7.4%, a difference of 0.15%), Pennsylvania German (7.4%, a difference of 0.21%), and Ecuadorian (7.4%, a difference of 0.23%).
| Demographics | Rating | Rank | Unemployment Among Ages 25 to 29 years |
| Ottawa | 0.1 /100 | #258 | Tragic 7.3% |
| Cree | 0.1 /100 | #259 | Tragic 7.3% |
| Americans | 0.1 /100 | #260 | Tragic 7.4% |
| Nigerians | 0.1 /100 | #261 | Tragic 7.4% |
| Ecuadorians | 0.1 /100 | #262 | Tragic 7.4% |
| Kiowa | 0.1 /100 | #263 | Tragic 7.4% |
| Immigrants | Western Africa | 0.1 /100 | #264 | Tragic 7.4% |
| Immigrants | Fiji | 0.1 /100 | #265 | Tragic 7.4% |
| Paiute | 0.1 /100 | #266 | Tragic 7.4% |
| Pennsylvania Germans | 0.1 /100 | #267 | Tragic 7.4% |
| Immigrants | Ecuador | 0.1 /100 | #268 | Tragic 7.4% |
| Immigrants | Latin America | 0.1 /100 | #269 | Tragic 7.4% |
| Bahamians | 0.0 /100 | #270 | Tragic 7.5% |
| Choctaw | 0.0 /100 | #271 | Tragic 7.5% |
| Immigrants | Bahamas | 0.0 /100 | #272 | Tragic 7.5% |