Colombian vs Hawaiian Unemployment Among Youth under 25 years
COMPARE
Colombian
Hawaiian
Unemployment Among Youth under 25 years
Unemployment Among Youth under 25 years Comparison
Colombians
Hawaiians
11.9%
UNEMPLOYMENT AMONG YOUTH UNDER 25 YEARS
9.1/ 100
METRIC RATING
212th/ 347
METRIC RANK
12.0%
UNEMPLOYMENT AMONG YOUTH UNDER 25 YEARS
3.5/ 100
METRIC RATING
224th/ 347
METRIC RANK
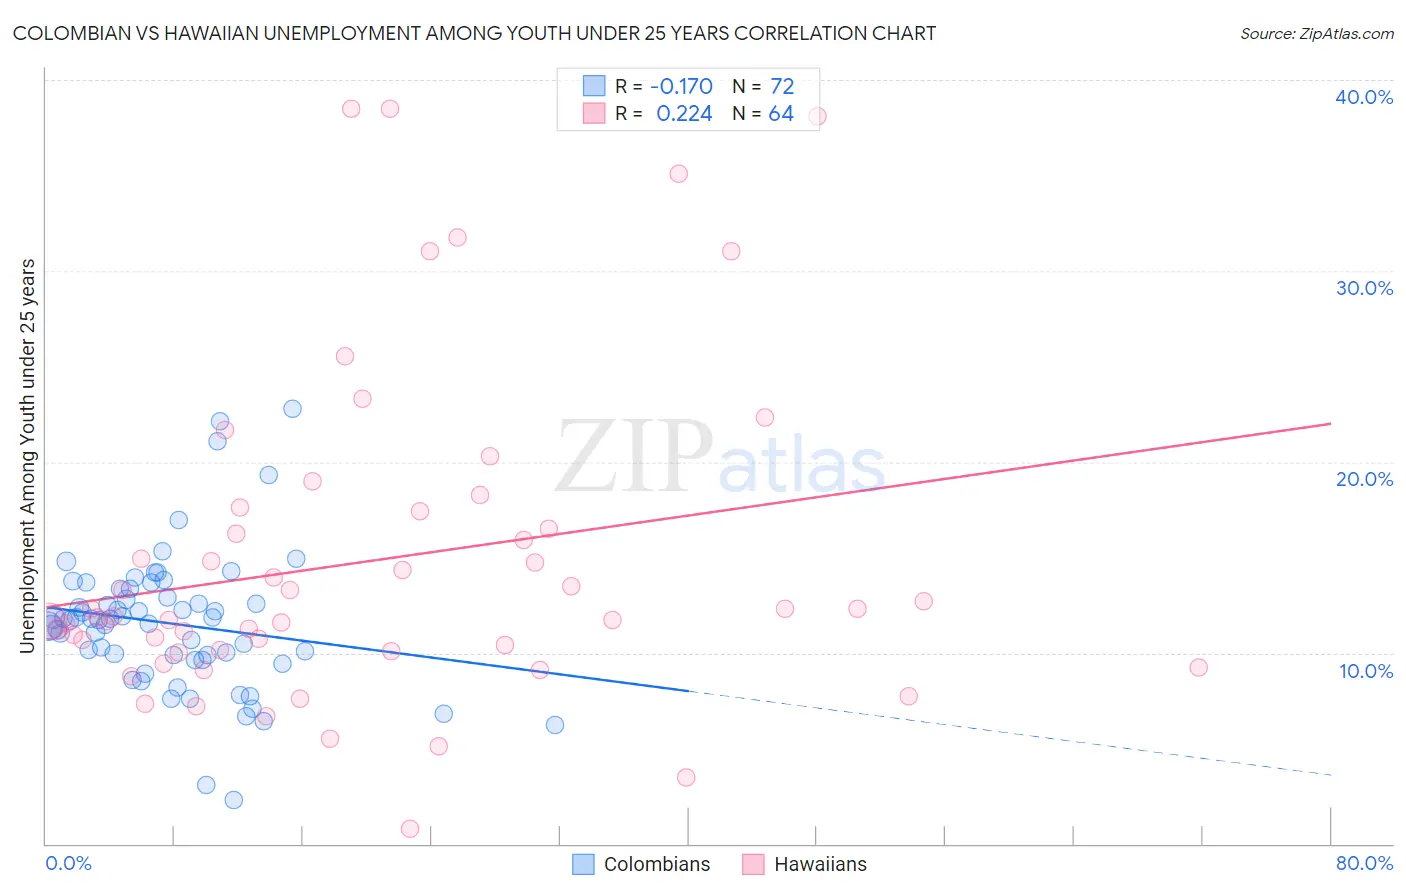
Colombian vs Hawaiian Unemployment Among Youth under 25 years Correlation Chart
The statistical analysis conducted on geographies consisting of 414,681,795 people shows a poor negative correlation between the proportion of Colombians and unemployment rate among youth under the age of 25 in the United States with a correlation coefficient (R) of -0.170 and weighted average of 11.9%. Similarly, the statistical analysis conducted on geographies consisting of 324,271,631 people shows a weak positive correlation between the proportion of Hawaiians and unemployment rate among youth under the age of 25 in the United States with a correlation coefficient (R) of 0.224 and weighted average of 12.0%, a difference of 1.0%.
Unemployment Among Youth under 25 years Correlation Summary
| Measurement | Colombian | Hawaiian |
| Minimum | 2.3% | 0.80% |
| Maximum | 22.8% | 38.5% |
| Range | 20.5% | 37.7% |
| Mean | 11.5% | 14.8% |
| Median | 11.7% | 11.9% |
| Interquartile 25% (IQ1) | 9.7% | 10.1% |
| Interquartile 75% (IQ3) | 13.1% | 16.9% |
| Interquartile Range (IQR) | 3.4% | 6.8% |
| Standard Deviation (Sample) | 3.6% | 8.5% |
| Standard Deviation (Population) | 3.6% | 8.4% |
Demographics Similar to Colombians and Hawaiians by Unemployment Among Youth under 25 years
In terms of unemployment among youth under 25 years, the demographic groups most similar to Colombians are Immigrants from Philippines (11.9%, a difference of 0.010%), South American (11.9%, a difference of 0.070%), Assyrian/Chaldean/Syriac (11.9%, a difference of 0.090%), Costa Rican (11.9%, a difference of 0.12%), and Samoan (11.9%, a difference of 0.23%). Similarly, the demographic groups most similar to Hawaiians are Immigrants from Ireland (12.0%, a difference of 0.010%), Israeli (12.0%, a difference of 0.15%), Immigrants from Ukraine (12.0%, a difference of 0.15%), Immigrants from Israel (12.0%, a difference of 0.29%), and Immigrants from Iran (12.0%, a difference of 0.31%).
| Demographics | Rating | Rank | Unemployment Among Youth under 25 years |
| Comanche | 12.1 /100 | #208 | Poor 11.8% |
| Immigrants | Lebanon | 11.3 /100 | #209 | Poor 11.8% |
| Assyrians/Chaldeans/Syriacs | 9.8 /100 | #210 | Tragic 11.9% |
| Immigrants | Philippines | 9.2 /100 | #211 | Tragic 11.9% |
| Colombians | 9.1 /100 | #212 | Tragic 11.9% |
| South Americans | 8.5 /100 | #213 | Tragic 11.9% |
| Costa Ricans | 8.2 /100 | #214 | Tragic 11.9% |
| Samoans | 7.4 /100 | #215 | Tragic 11.9% |
| Guamanians/Chamorros | 7.0 /100 | #216 | Tragic 11.9% |
| Yaqui | 6.9 /100 | #217 | Tragic 11.9% |
| Immigrants | Middle Africa | 6.8 /100 | #218 | Tragic 11.9% |
| Immigrants | Nonimmigrants | 6.2 /100 | #219 | Tragic 11.9% |
| Alsatians | 6.1 /100 | #220 | Tragic 11.9% |
| Immigrants | Portugal | 4.9 /100 | #221 | Tragic 12.0% |
| Israelis | 4.1 /100 | #222 | Tragic 12.0% |
| Immigrants | Ireland | 3.5 /100 | #223 | Tragic 12.0% |
| Hawaiians | 3.5 /100 | #224 | Tragic 12.0% |
| Immigrants | Ukraine | 3.0 /100 | #225 | Tragic 12.0% |
| Immigrants | Israel | 2.6 /100 | #226 | Tragic 12.0% |
| Immigrants | Iran | 2.6 /100 | #227 | Tragic 12.0% |
| Immigrants | Fiji | 2.1 /100 | #228 | Tragic 12.1% |