Chippewa vs Welsh Unemployment Among Ages 35 to 44 years
COMPARE
Chippewa
Welsh
Unemployment Among Ages 35 to 44 years
Unemployment Among Ages 35 to 44 years Comparison
Chippewa
Welsh
6.2%
UNEMPLOYMENT AMONG AGES 35 TO 44 YEARS
0.0/ 100
METRIC RATING
321st/ 347
METRIC RANK
4.5%
UNEMPLOYMENT AMONG AGES 35 TO 44 YEARS
91.6/ 100
METRIC RATING
103rd/ 347
METRIC RANK
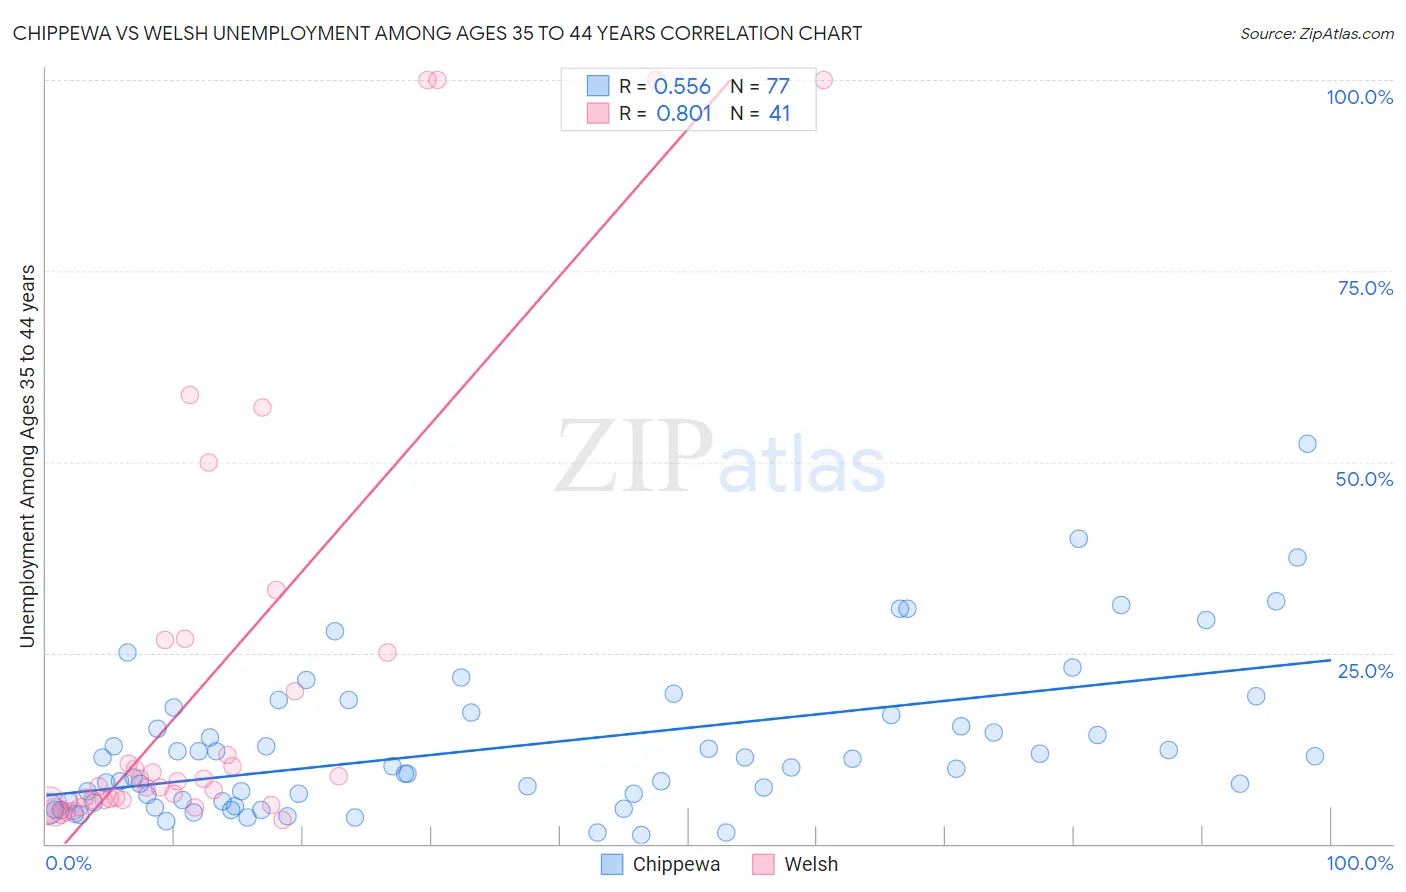
Chippewa vs Welsh Unemployment Among Ages 35 to 44 years Correlation Chart
The statistical analysis conducted on geographies consisting of 210,498,469 people shows a substantial positive correlation between the proportion of Chippewa and unemployment rate among population between the ages 35 and 44 in the United States with a correlation coefficient (R) of 0.556 and weighted average of 6.2%. Similarly, the statistical analysis conducted on geographies consisting of 498,709,039 people shows a very strong positive correlation between the proportion of Welsh and unemployment rate among population between the ages 35 and 44 in the United States with a correlation coefficient (R) of 0.801 and weighted average of 4.5%, a difference of 38.7%.
Unemployment Among Ages 35 to 44 years Correlation Summary
| Measurement | Chippewa | Welsh |
| Minimum | 1.2% | 3.1% |
| Maximum | 52.4% | 100.0% |
| Range | 51.2% | 96.9% |
| Mean | 12.7% | 21.8% |
| Median | 10.0% | 8.2% |
| Interquartile 25% (IQ1) | 5.5% | 5.7% |
| Interquartile 75% (IQ3) | 17.0% | 25.8% |
| Interquartile Range (IQR) | 11.5% | 20.1% |
| Standard Deviation (Sample) | 10.0% | 29.5% |
| Standard Deviation (Population) | 9.9% | 29.1% |
Similar Demographics by Unemployment Among Ages 35 to 44 years
Demographics Similar to Chippewa by Unemployment Among Ages 35 to 44 years
In terms of unemployment among ages 35 to 44 years, the demographic groups most similar to Chippewa are Immigrants from Armenia (6.2%, a difference of 0.060%), Immigrants from Grenada (6.2%, a difference of 0.30%), Colville (6.2%, a difference of 0.55%), Immigrants from St. Vincent and the Grenadines (6.2%, a difference of 0.97%), and Tsimshian (6.2%, a difference of 1.2%).
| Demographics | Rating | Rank | Unemployment Among Ages 35 to 44 years |
| Immigrants | Dominica | 0.0 /100 | #314 | Tragic 6.0% |
| Blacks/African Americans | 0.0 /100 | #315 | Tragic 6.1% |
| Tsimshian | 0.0 /100 | #316 | Tragic 6.2% |
| Immigrants | St. Vincent and the Grenadines | 0.0 /100 | #317 | Tragic 6.2% |
| Colville | 0.0 /100 | #318 | Tragic 6.2% |
| Immigrants | Grenada | 0.0 /100 | #319 | Tragic 6.2% |
| Immigrants | Armenia | 0.0 /100 | #320 | Tragic 6.2% |
| Chippewa | 0.0 /100 | #321 | Tragic 6.2% |
| Immigrants | Dominican Republic | 0.0 /100 | #322 | Tragic 6.4% |
| Dominicans | 0.0 /100 | #323 | Tragic 6.4% |
| Menominee | 0.0 /100 | #324 | Tragic 6.5% |
| Immigrants | Yemen | 0.0 /100 | #325 | Tragic 6.6% |
| Alaska Natives | 0.0 /100 | #326 | Tragic 6.6% |
| Cape Verdeans | 0.0 /100 | #327 | Tragic 6.6% |
| Shoshone | 0.0 /100 | #328 | Tragic 6.6% |
Demographics Similar to Welsh by Unemployment Among Ages 35 to 44 years
In terms of unemployment among ages 35 to 44 years, the demographic groups most similar to Welsh are Finnish (4.5%, a difference of 0.020%), Immigrants from Sudan (4.5%, a difference of 0.030%), Immigrants from Netherlands (4.5%, a difference of 0.060%), Italian (4.5%, a difference of 0.070%), and Immigrants from Saudi Arabia (4.5%, a difference of 0.080%).
| Demographics | Rating | Rank | Unemployment Among Ages 35 to 44 years |
| Scottish | 93.5 /100 | #96 | Exceptional 4.5% |
| Immigrants | France | 92.5 /100 | #97 | Exceptional 4.5% |
| Immigrants | Canada | 92.3 /100 | #98 | Exceptional 4.5% |
| Immigrants | Egypt | 92.3 /100 | #99 | Exceptional 4.5% |
| Italians | 91.9 /100 | #100 | Exceptional 4.5% |
| Immigrants | Netherlands | 91.9 /100 | #101 | Exceptional 4.5% |
| Immigrants | Sudan | 91.8 /100 | #102 | Exceptional 4.5% |
| Welsh | 91.6 /100 | #103 | Exceptional 4.5% |
| Finns | 91.6 /100 | #104 | Exceptional 4.5% |
| Immigrants | Saudi Arabia | 91.3 /100 | #105 | Exceptional 4.5% |
| Immigrants | North America | 91.1 /100 | #106 | Exceptional 4.5% |
| Immigrants | North Macedonia | 90.7 /100 | #107 | Exceptional 4.5% |
| New Zealanders | 90.3 /100 | #108 | Exceptional 4.5% |
| Romanians | 90.3 /100 | #109 | Exceptional 4.5% |
| Immigrants | Kazakhstan | 90.0 /100 | #110 | Excellent 4.5% |