Chinese vs Immigrants from Italy Unemployment Among Women with Children Under 6 years
COMPARE
Chinese
Immigrants from Italy
Unemployment Among Women with Children Under 6 years
Unemployment Among Women with Children Under 6 years Comparison
Chinese
Immigrants from Italy
6.8%
UNEMPLOYMENT AMONG WOMEN WITH CHILDREN UNDER 6 YEARS
99.9/ 100
METRIC RATING
53rd/ 347
METRIC RANK
7.2%
UNEMPLOYMENT AMONG WOMEN WITH CHILDREN UNDER 6 YEARS
96.1/ 100
METRIC RATING
115th/ 347
METRIC RANK
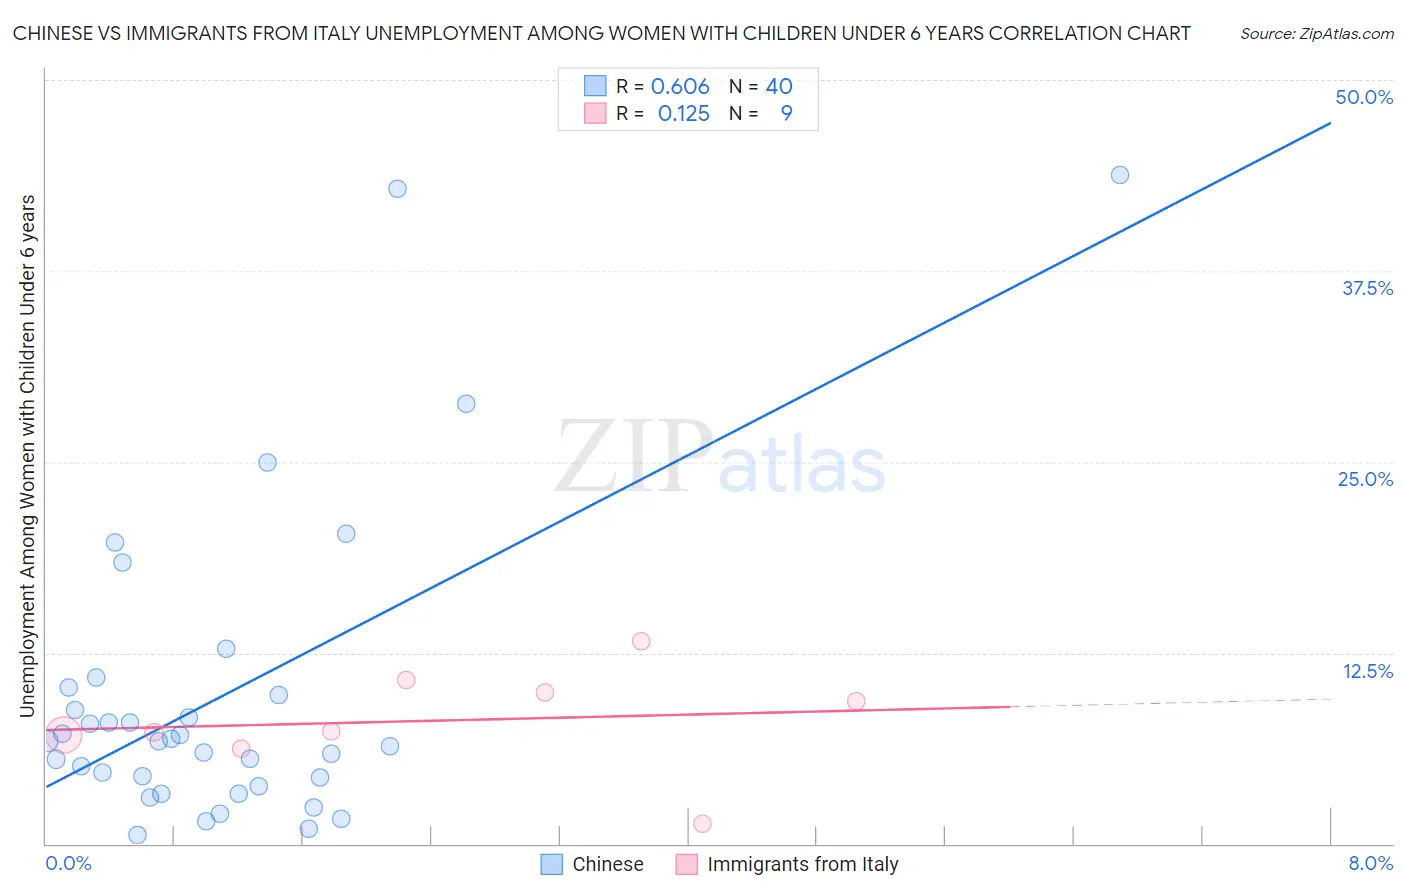
Chinese vs Immigrants from Italy Unemployment Among Women with Children Under 6 years Correlation Chart
The statistical analysis conducted on geographies consisting of 60,145,529 people shows a significant positive correlation between the proportion of Chinese and unemployment rate among women with children under the age of 6 in the United States with a correlation coefficient (R) of 0.606 and weighted average of 6.8%. Similarly, the statistical analysis conducted on geographies consisting of 250,790,462 people shows a poor positive correlation between the proportion of Immigrants from Italy and unemployment rate among women with children under the age of 6 in the United States with a correlation coefficient (R) of 0.125 and weighted average of 7.2%, a difference of 6.5%.
Unemployment Among Women with Children Under 6 years Correlation Summary
| Measurement | Chinese | Immigrants from Italy |
| Minimum | 0.58% | 1.3% |
| Maximum | 43.8% | 13.2% |
| Range | 43.2% | 11.9% |
| Mean | 9.7% | 8.1% |
| Median | 6.7% | 7.4% |
| Interquartile 25% (IQ1) | 4.1% | 6.7% |
| Interquartile 75% (IQ3) | 9.9% | 10.3% |
| Interquartile Range (IQR) | 5.9% | 3.6% |
| Standard Deviation (Sample) | 10.1% | 3.4% |
| Standard Deviation (Population) | 9.9% | 3.2% |
Similar Demographics by Unemployment Among Women with Children Under 6 years
Demographics Similar to Chinese by Unemployment Among Women with Children Under 6 years
In terms of unemployment among women with children under 6 years, the demographic groups most similar to Chinese are Immigrants from Iran (6.8%, a difference of 0.070%), Immigrants from Latvia (6.8%, a difference of 0.17%), Ethiopian (6.8%, a difference of 0.19%), Immigrants from Ireland (6.8%, a difference of 0.20%), and Immigrants from Nepal (6.8%, a difference of 0.21%).
| Demographics | Rating | Rank | Unemployment Among Women with Children Under 6 years |
| Latvians | 99.9 /100 | #46 | Exceptional 6.8% |
| Immigrants | Asia | 99.9 /100 | #47 | Exceptional 6.8% |
| Immigrants | Switzerland | 99.9 /100 | #48 | Exceptional 6.8% |
| Immigrants | Nepal | 99.9 /100 | #49 | Exceptional 6.8% |
| Immigrants | Ireland | 99.9 /100 | #50 | Exceptional 6.8% |
| Ethiopians | 99.9 /100 | #51 | Exceptional 6.8% |
| Immigrants | Iran | 99.9 /100 | #52 | Exceptional 6.8% |
| Chinese | 99.9 /100 | #53 | Exceptional 6.8% |
| Immigrants | Latvia | 99.9 /100 | #54 | Exceptional 6.8% |
| Immigrants | Ukraine | 99.8 /100 | #55 | Exceptional 6.8% |
| Immigrants | Ethiopia | 99.8 /100 | #56 | Exceptional 6.9% |
| Icelanders | 99.8 /100 | #57 | Exceptional 6.9% |
| Immigrants | Turkey | 99.8 /100 | #58 | Exceptional 6.9% |
| Immigrants | Serbia | 99.8 /100 | #59 | Exceptional 6.9% |
| Immigrants | Sri Lanka | 99.8 /100 | #60 | Exceptional 6.9% |
Demographics Similar to Immigrants from Italy by Unemployment Among Women with Children Under 6 years
In terms of unemployment among women with children under 6 years, the demographic groups most similar to Immigrants from Italy are Argentinean (7.2%, a difference of 0.080%), Armenian (7.2%, a difference of 0.10%), Nicaraguan (7.2%, a difference of 0.12%), Israeli (7.2%, a difference of 0.20%), and Immigrants from Kenya (7.3%, a difference of 0.30%).
| Demographics | Rating | Rank | Unemployment Among Women with Children Under 6 years |
| Eastern Europeans | 96.9 /100 | #108 | Exceptional 7.2% |
| Australians | 96.9 /100 | #109 | Exceptional 7.2% |
| Palestinians | 96.8 /100 | #110 | Exceptional 7.2% |
| Norwegians | 96.7 /100 | #111 | Exceptional 7.2% |
| Israelis | 96.5 /100 | #112 | Exceptional 7.2% |
| Nicaraguans | 96.3 /100 | #113 | Exceptional 7.2% |
| Argentineans | 96.2 /100 | #114 | Exceptional 7.2% |
| Immigrants | Italy | 96.1 /100 | #115 | Exceptional 7.2% |
| Armenians | 95.9 /100 | #116 | Exceptional 7.2% |
| Immigrants | Kenya | 95.4 /100 | #117 | Exceptional 7.3% |
| Serbians | 94.5 /100 | #118 | Exceptional 7.3% |
| South Africans | 94.1 /100 | #119 | Exceptional 7.3% |
| Iraqis | 93.9 /100 | #120 | Exceptional 7.3% |
| Immigrants | Chile | 93.5 /100 | #121 | Exceptional 7.3% |
| Immigrants | Bosnia and Herzegovina | 93.5 /100 | #122 | Exceptional 7.3% |