Chilean vs Immigrants from South Africa Unemployment Among Ages 16 to 19 years
COMPARE
Chilean
Immigrants from South Africa
Unemployment Among Ages 16 to 19 years
Unemployment Among Ages 16 to 19 years Comparison
Chileans
Immigrants from South Africa
17.6%
UNEMPLOYMENT AMONG AGES 16 TO 19 YEARS
50.8/ 100
METRIC RATING
173rd/ 347
METRIC RANK
16.9%
UNEMPLOYMENT AMONG AGES 16 TO 19 YEARS
96.9/ 100
METRIC RATING
88th/ 347
METRIC RANK
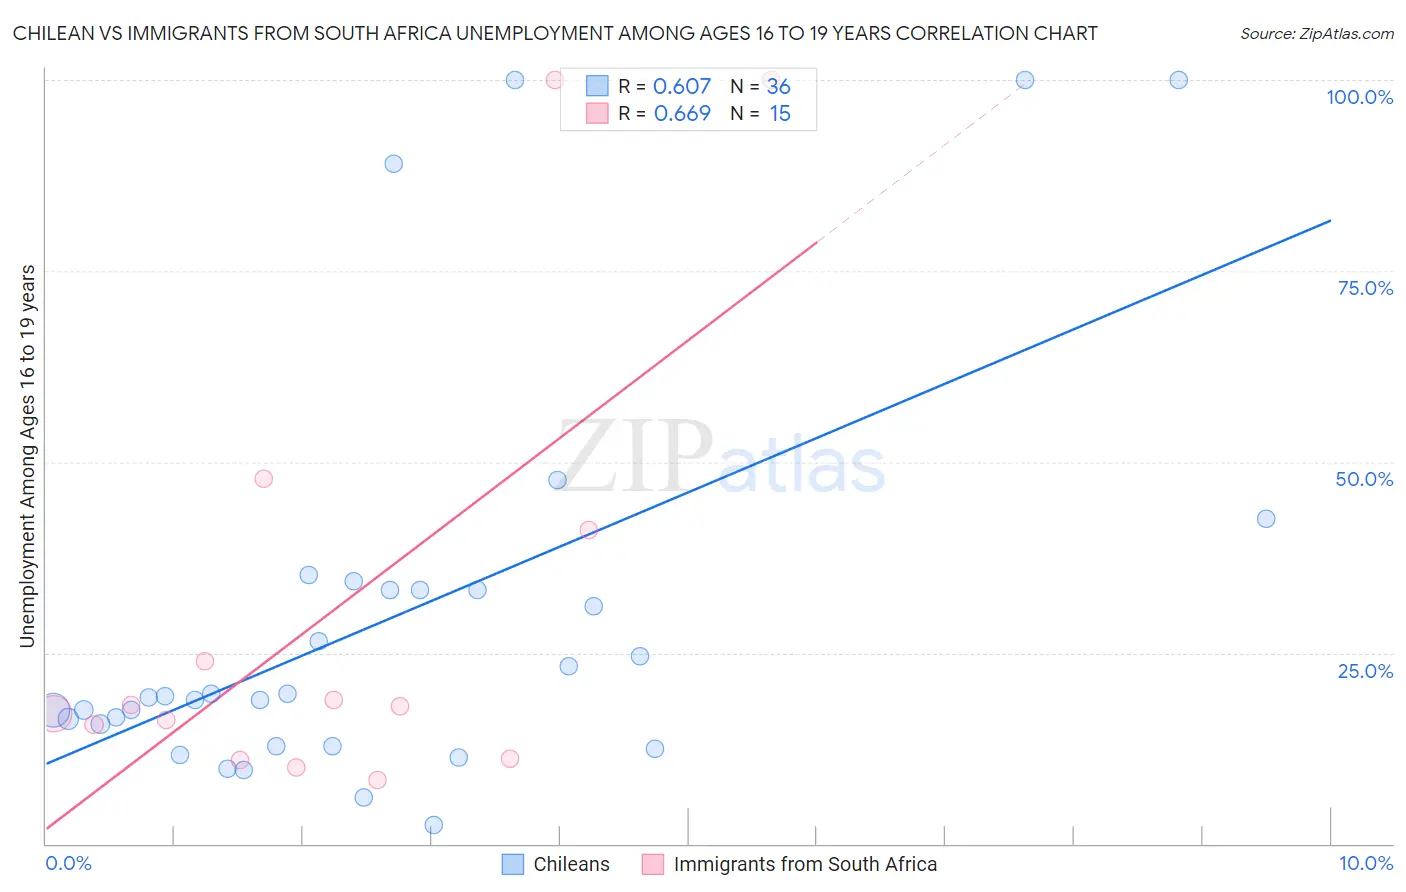
Chilean vs Immigrants from South Africa Unemployment Among Ages 16 to 19 years Correlation Chart
The statistical analysis conducted on geographies consisting of 248,696,399 people shows a significant positive correlation between the proportion of Chileans and unemployment rate among population between the ages 16 and 19 in the United States with a correlation coefficient (R) of 0.607 and weighted average of 17.6%. Similarly, the statistical analysis conducted on geographies consisting of 224,163,743 people shows a significant positive correlation between the proportion of Immigrants from South Africa and unemployment rate among population between the ages 16 and 19 in the United States with a correlation coefficient (R) of 0.669 and weighted average of 16.9%, a difference of 4.2%.
Unemployment Among Ages 16 to 19 years Correlation Summary
| Measurement | Chilean | Immigrants from South Africa |
| Minimum | 2.5% | 8.4% |
| Maximum | 100.0% | 100.0% |
| Range | 97.5% | 91.6% |
| Mean | 29.4% | 30.5% |
| Median | 19.2% | 18.0% |
| Interquartile 25% (IQ1) | 14.2% | 11.1% |
| Interquartile 75% (IQ3) | 33.3% | 41.0% |
| Interquartile Range (IQR) | 19.1% | 29.9% |
| Standard Deviation (Sample) | 26.3% | 30.3% |
| Standard Deviation (Population) | 26.0% | 29.2% |
Similar Demographics by Unemployment Among Ages 16 to 19 years
Demographics Similar to Chileans by Unemployment Among Ages 16 to 19 years
In terms of unemployment among ages 16 to 19 years, the demographic groups most similar to Chileans are Osage (17.6%, a difference of 0.040%), Immigrants from Western Europe (17.6%, a difference of 0.070%), Immigrants from Sweden (17.6%, a difference of 0.080%), Nicaraguan (17.6%, a difference of 0.090%), and Bermudan (17.6%, a difference of 0.10%).
| Demographics | Rating | Rank | Unemployment Among Ages 16 to 19 years |
| Immigrants | Italy | 55.2 /100 | #166 | Average 17.5% |
| Immigrants | France | 54.9 /100 | #167 | Average 17.5% |
| Immigrants | Hungary | 54.7 /100 | #168 | Average 17.5% |
| Immigrants | Cambodia | 54.5 /100 | #169 | Average 17.5% |
| Immigrants | Romania | 53.3 /100 | #170 | Average 17.5% |
| Immigrants | Switzerland | 53.2 /100 | #171 | Average 17.5% |
| Immigrants | Western Europe | 52.2 /100 | #172 | Average 17.6% |
| Chileans | 50.8 /100 | #173 | Average 17.6% |
| Osage | 50.0 /100 | #174 | Average 17.6% |
| Immigrants | Sweden | 49.1 /100 | #175 | Average 17.6% |
| Nicaraguans | 48.9 /100 | #176 | Average 17.6% |
| Bermudans | 48.7 /100 | #177 | Average 17.6% |
| Celtics | 48.7 /100 | #178 | Average 17.6% |
| Americans | 47.4 /100 | #179 | Average 17.6% |
| Spaniards | 47.1 /100 | #180 | Average 17.6% |
Demographics Similar to Immigrants from South Africa by Unemployment Among Ages 16 to 19 years
In terms of unemployment among ages 16 to 19 years, the demographic groups most similar to Immigrants from South Africa are Greek (16.9%, a difference of 0.060%), Canadian (16.9%, a difference of 0.090%), Immigrants from Scotland (16.8%, a difference of 0.12%), Immigrants from Kuwait (16.8%, a difference of 0.13%), and Asian (16.9%, a difference of 0.13%).
| Demographics | Rating | Rank | Unemployment Among Ages 16 to 19 years |
| Immigrants | Latvia | 97.5 /100 | #81 | Exceptional 16.8% |
| Whites/Caucasians | 97.5 /100 | #82 | Exceptional 16.8% |
| Ugandans | 97.4 /100 | #83 | Exceptional 16.8% |
| French | 97.4 /100 | #84 | Exceptional 16.8% |
| Immigrants | Kuwait | 97.2 /100 | #85 | Exceptional 16.8% |
| Immigrants | Scotland | 97.2 /100 | #86 | Exceptional 16.8% |
| Greeks | 97.0 /100 | #87 | Exceptional 16.9% |
| Immigrants | South Africa | 96.9 /100 | #88 | Exceptional 16.9% |
| Canadians | 96.7 /100 | #89 | Exceptional 16.9% |
| Asians | 96.6 /100 | #90 | Exceptional 16.9% |
| Cambodians | 96.3 /100 | #91 | Exceptional 16.9% |
| South Africans | 95.9 /100 | #92 | Exceptional 16.9% |
| Cubans | 95.8 /100 | #93 | Exceptional 16.9% |
| Bangladeshis | 95.8 /100 | #94 | Exceptional 16.9% |
| Mongolians | 95.6 /100 | #95 | Exceptional 16.9% |