Chilean vs Immigrants from Netherlands Male Unemployment
COMPARE
Chilean
Immigrants from Netherlands
Male Unemployment
Male Unemployment Comparison
Chileans
Immigrants from Netherlands
5.0%
MALE UNEMPLOYMENT
96.2/ 100
METRIC RATING
82nd/ 347
METRIC RANK
5.0%
MALE UNEMPLOYMENT
98.3/ 100
METRIC RATING
59th/ 347
METRIC RANK
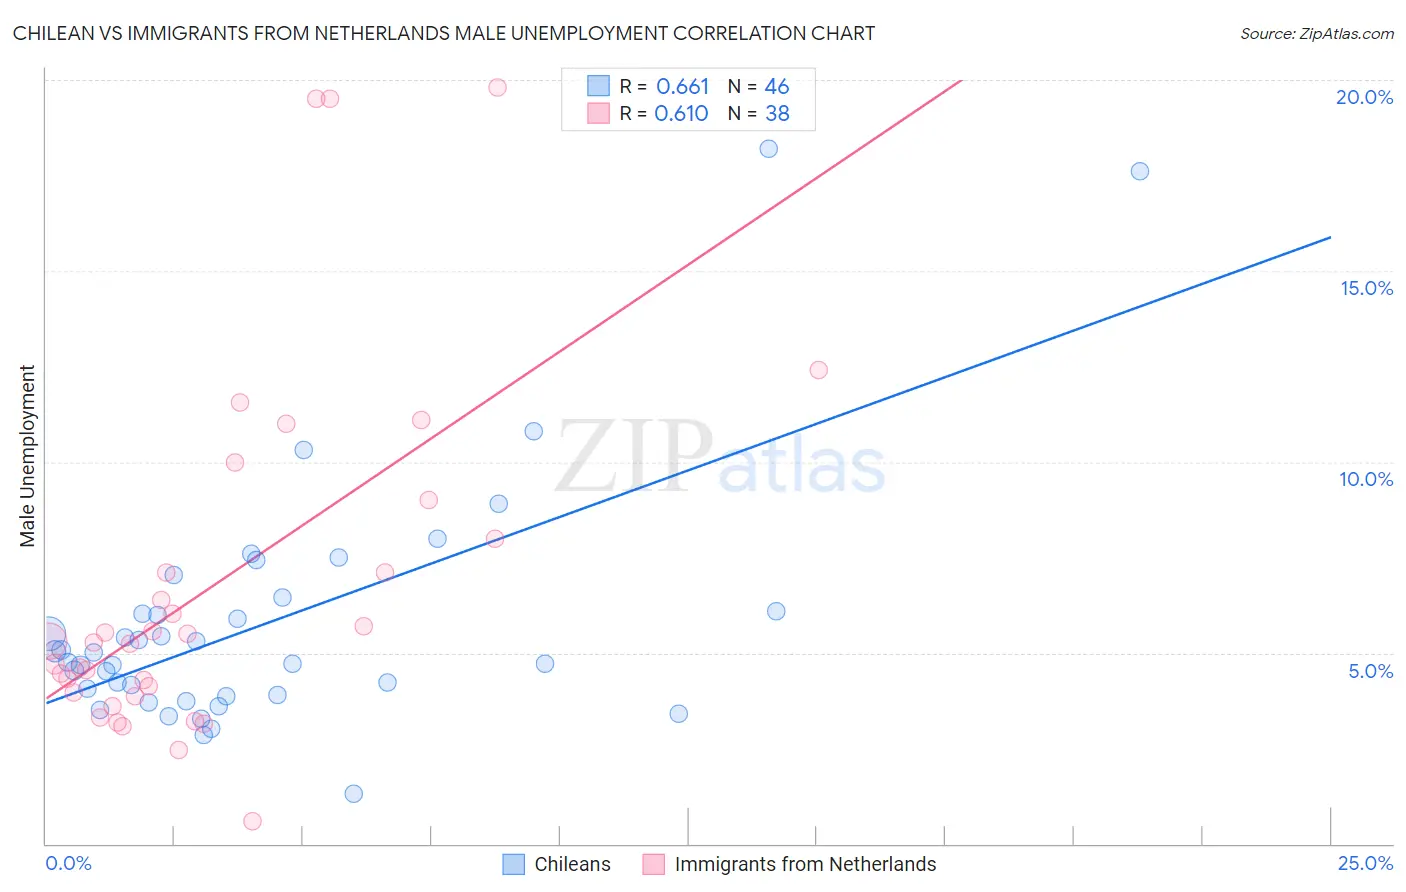
Chilean vs Immigrants from Netherlands Male Unemployment Correlation Chart
The statistical analysis conducted on geographies consisting of 256,250,664 people shows a significant positive correlation between the proportion of Chileans and unemployment rate among males in the United States with a correlation coefficient (R) of 0.661 and weighted average of 5.0%. Similarly, the statistical analysis conducted on geographies consisting of 237,368,894 people shows a significant positive correlation between the proportion of Immigrants from Netherlands and unemployment rate among males in the United States with a correlation coefficient (R) of 0.610 and weighted average of 5.0%, a difference of 1.3%.
Male Unemployment Correlation Summary
| Measurement | Chilean | Immigrants from Netherlands |
| Minimum | 1.3% | 0.60% |
| Maximum | 18.2% | 19.8% |
| Range | 16.9% | 19.2% |
| Mean | 5.8% | 6.8% |
| Median | 4.9% | 5.3% |
| Interquartile 25% (IQ1) | 3.9% | 4.0% |
| Interquartile 75% (IQ3) | 6.1% | 8.0% |
| Interquartile Range (IQR) | 2.2% | 4.0% |
| Standard Deviation (Sample) | 3.2% | 4.7% |
| Standard Deviation (Population) | 3.2% | 4.6% |
Similar Demographics by Male Unemployment
Demographics Similar to Chileans by Male Unemployment
In terms of male unemployment, the demographic groups most similar to Chileans are French (5.0%, a difference of 0.030%), Argentinean (5.0%, a difference of 0.040%), Immigrants from Eritrea (5.0%, a difference of 0.060%), South African (5.0%, a difference of 0.090%), and Immigrants from Northern Europe (5.0%, a difference of 0.10%).
| Demographics | Rating | Rank | Male Unemployment |
| Assyrians/Chaldeans/Syriacs | 96.9 /100 | #75 | Exceptional 5.0% |
| Immigrants | Sudan | 96.5 /100 | #76 | Exceptional 5.0% |
| Iranians | 96.4 /100 | #77 | Exceptional 5.0% |
| Immigrants | Northern Europe | 96.4 /100 | #78 | Exceptional 5.0% |
| South Africans | 96.4 /100 | #79 | Exceptional 5.0% |
| Argentineans | 96.2 /100 | #80 | Exceptional 5.0% |
| French | 96.2 /100 | #81 | Exceptional 5.0% |
| Chileans | 96.2 /100 | #82 | Exceptional 5.0% |
| Immigrants | Eritrea | 96.0 /100 | #83 | Exceptional 5.0% |
| Serbians | 95.7 /100 | #84 | Exceptional 5.1% |
| Immigrants | North Macedonia | 95.6 /100 | #85 | Exceptional 5.1% |
| Maltese | 95.5 /100 | #86 | Exceptional 5.1% |
| Immigrants | Romania | 95.4 /100 | #87 | Exceptional 5.1% |
| Immigrants | Sri Lanka | 94.9 /100 | #88 | Exceptional 5.1% |
| Immigrants | Australia | 94.7 /100 | #89 | Exceptional 5.1% |
Demographics Similar to Immigrants from Netherlands by Male Unemployment
In terms of male unemployment, the demographic groups most similar to Immigrants from Netherlands are Turkish (5.0%, a difference of 0.14%), Lithuanian (5.0%, a difference of 0.14%), Immigrants from Argentina (5.0%, a difference of 0.18%), Cambodian (5.0%, a difference of 0.26%), and Immigrants from Bulgaria (5.0%, a difference of 0.37%).
| Demographics | Rating | Rank | Male Unemployment |
| Irish | 98.8 /100 | #52 | Exceptional 5.0% |
| Jordanians | 98.8 /100 | #53 | Exceptional 5.0% |
| Yugoslavians | 98.7 /100 | #54 | Exceptional 5.0% |
| Czechoslovakians | 98.7 /100 | #55 | Exceptional 5.0% |
| Immigrants | Bulgaria | 98.7 /100 | #56 | Exceptional 5.0% |
| Turks | 98.5 /100 | #57 | Exceptional 5.0% |
| Lithuanians | 98.5 /100 | #58 | Exceptional 5.0% |
| Immigrants | Netherlands | 98.3 /100 | #59 | Exceptional 5.0% |
| Immigrants | Argentina | 98.1 /100 | #60 | Exceptional 5.0% |
| Cambodians | 98.1 /100 | #61 | Exceptional 5.0% |
| Basques | 97.9 /100 | #62 | Exceptional 5.0% |
| Eastern Europeans | 97.9 /100 | #63 | Exceptional 5.0% |
| Celtics | 97.8 /100 | #64 | Exceptional 5.0% |
| Icelanders | 97.6 /100 | #65 | Exceptional 5.0% |
| Finns | 97.5 /100 | #66 | Exceptional 5.0% |